The Stock Market Has Peaked
Stock-Markets / Stock Markets 2014 Nov 29, 2014 - 05:51 PM GMTBy: Thomas_Clayton
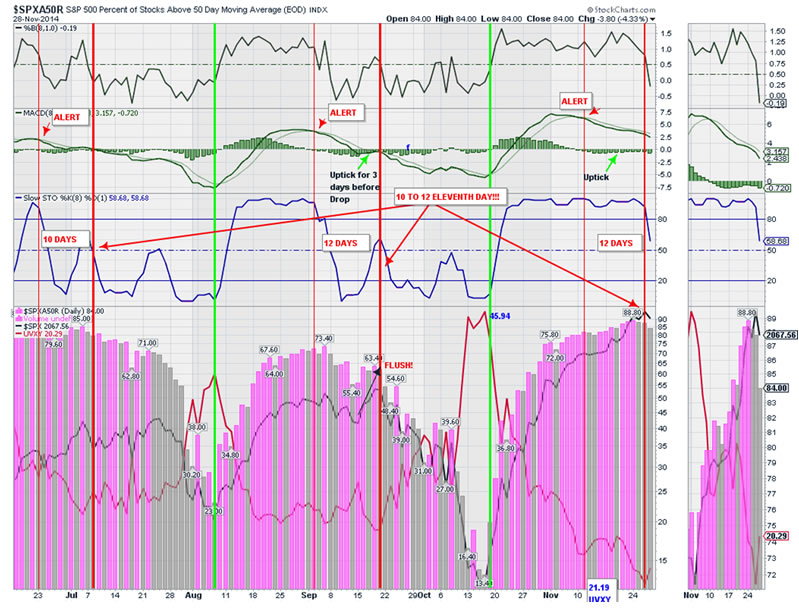
SPXA50R measures the stocks above the 50 day Moving Average which gives perfect timing of Market Tops and Bottoms.
The Macd line cross is the Alert, Followed by %B below 0.5 and Slow Sto below 80 has proven to be Sell Signals
Behind the pink Histogram primary chart, you can see the SPX down and the Vix at the bottom right turning Up.

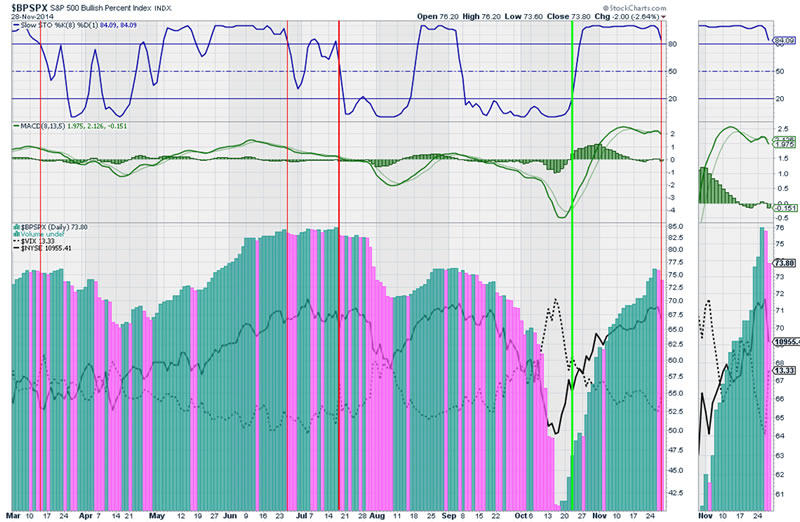
$BPSPXA Bullish Per Centage, Nov 28, Start of Sell Signal, which confirms Chart of SPXA50R stocks above 50 MA.

By Thomas Clayton
© 2013 Copyright Thomas Clayton - All Rights Reserved
Disclaimer: The above is a matter of opinion provided for general information purposes only and is not intended as investment advice. Information and analysis above are derived from sources and utilising methods believed to be reliable, but we cannot accept responsibility for any losses you may incur as a result of this analysis. Individuals should consult with their personal financial advisors.
© 2005-2022 http://www.MarketOracle.co.uk - The Market Oracle is a FREE Daily Financial Markets Analysis & Forecasting online publication.


