U.S. Treasury Bonds Outperforming S&P 500 Stocks Index
Stock-Markets / Stock Markets 2014 Nov 29, 2014 - 01:17 PM GMTBy: Sy_Harding
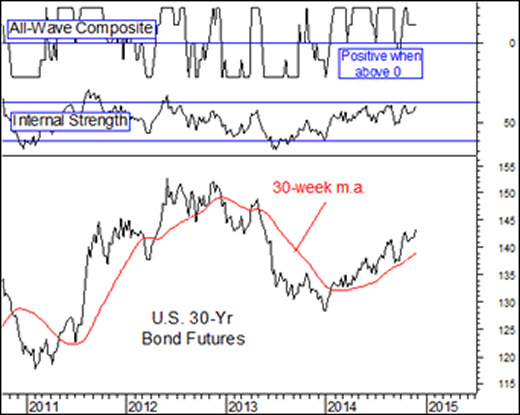
 It was a sure thing. With the Fed cutting back its massive QE bond-buying program this year bonds would plunge. Instead, they began rallying sharply in January, precisely when the Fed began tapering back QE.
It seems that economists expecting bonds to plunge failed to anticipate that foreign demand for U.S. treasury bonds would make up for the slowing of Fed bond buying.
More recently, experts expected bonds would surely begin declining this fall in anticipation of the Fed beginning to raise interest rates sometime next year, its next step toward normalizing monetary policy.
Instead, with the rest of the world’s economies, currencies, and bonds tumbling further into problems this year, U.S. bonds have continued to rally as a global safe haven.

The foreign buying influence was seen in the Treasury Department’s auction on Tuesday of $35 billion in five-year Treasury bills, which saw significant demand from global investors. The auction’s bid-to-cover ratio was on the high side at 2.91. Indirect bidders, a group that includes foreign central banks, bought 65% of the offering, compared to an average of 36% over the last four auctions.
The bond rally this year has the 30-year U.S. Treasury bond up 12.2% year-to-date. The iShares 20-year T’bond ETF, symbol TLT, is up 19.9% year-to-date.
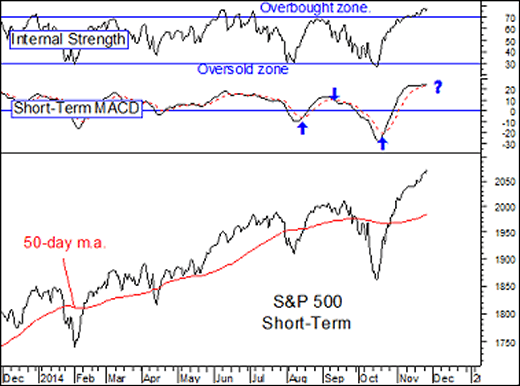
By comparison, the U.S. stock market stumbled in January and again in the Sept/Oct pullback. At its mid-October low, the stock market had given back all its year-to-date gains.
It then found support, the market’s favorable annual seasonality kicked in on schedule, and the stock market gained back all its losses and went on to new highs.

As a result, the S&P 500 is up 12.5% year-to-date, a double-digit gain, but trounced by safe-haven Treasury bonds.
The next question is which is at most risk. Is it stocks because at least short-term, the stock market is over-extended above key short-term moving averages, and short-term technical indicators are high in their overbought zones? Or is it bonds because their price moves opposite to their yields, and interest rates are expected to rise next year?
In the interest of full disclosure, we remain on a buy signal for both Treasury bonds and the stock market at the moment, and my subscribers and I have holdings that include the iShares 20-yr bond etf (TLT), the SPDR DJIA etf, (DIA), the S&P 500 Index etf (SPY), and others.
But the next few weeks could be interesting to say the least.
Sy Harding is president of Asset Management Research Corp., and editor of the free market blog Street Smart Post.
© 2014 Copyright Sy Harding- All Rights Reserved
Disclaimer: The above is a matter of opinion provided for general information purposes only and is not intended as investment advice. Information and analysis above are derived from sources and utilising methods believed to be reliable, but we cannot accept responsibility for any losses you may incur as a result of this analysis. Individuals should consult with their personal financial advisors.
Sy Harding Archive |
Raul Ilargi Meijer Archive |
© 2005-2022 http://www.MarketOracle.co.uk - The Market Oracle is a FREE Daily Financial Markets Analysis & Forecasting online publication.


