


Lindsay's Stock Market Right Shoulder
Stock-Markets / Stock Markets 2014 Nov 18, 2014 - 07:25 PM GMTBy: Ed_Carlson

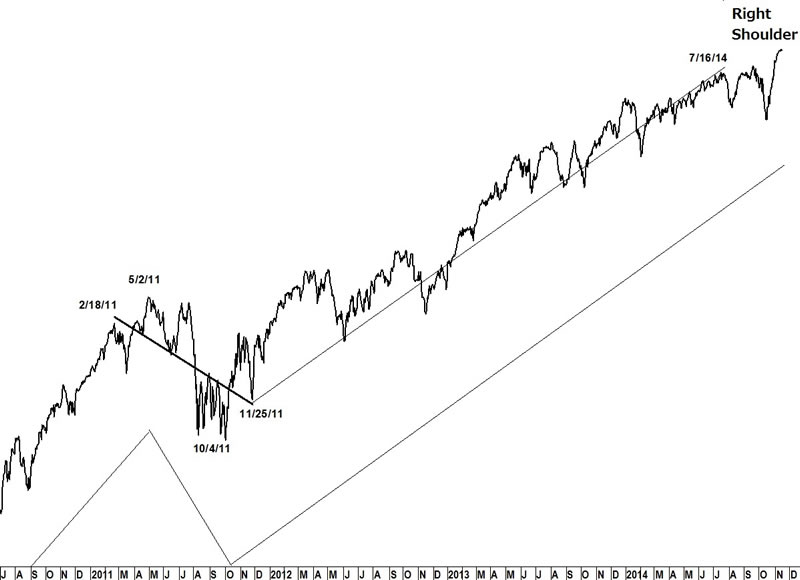
With the October rally exceeding the September high we find ourselves once again searching for the right shoulder high which will mark the end of the bull market.
The rally from the end of the Sideways Movement on 11/25/11 terminated at the July high earlier this year when, after 964 calendar days, the Dow had come to the end of the longest of Lindsay's standard time spans and dropped 770 points. We know from the preserved, written work of George Lindsay that a right shoulder always follows a long basic advance. While a right shoulder is usually lower than the high of the basic advance, Lindsay left open the possibility that a higher right shoulder is possible and history shows that it is not without precedent.
Multiple middle section forecasts for the high of the right shoulder are pointing to this Friday, 11/21/14. But the seasonal tendency for stocks to rally during the week of the US Thanksgiving holiday (Nov 24-28) presents the possibility that the high may be printed a week later than forecast (albeit within the margin of error for such forecasts).
While cycles (non-Lindsay) point to a high of unknown degree late this week - and a market pullback during the first half of December fits the seasonal pattern for equities - a forecast for a market top in November is really fighting end-of-year bullish seasonality. Assuming a cycle high arrives on schedule this Friday, and barring an absolute collapse in equities, we won't know for certain whether this is truly the end of the bull market until we see if the next cycle top, due in late January, manages to print a higher high. The high should fall within Lindsay's long-term interval of 15years to 15years, 11months. The longest this interval has ever stretched is 16years and 1month and a November high would make the interval from the Oct 1998 low 16years, 1month.
Try a "sneak-peek" at Lindsay research (and more) at Seattle Technical Advisors.
Ed Carlson, author of George Lindsay and the Art of Technical Analysis, and his new book, George Lindsay's An Aid to Timing is an independent trader, consultant, and Chartered Market Technician (CMT) based in Seattle. Carlson manages the website Seattle Technical Advisors.com, where he publishes daily and weekly commentary. He spent twenty years as a stockbroker and holds an M.B.A. from Wichita State University.
© 2014 Copyright Ed Carlson - All Rights Reserved
Disclaimer: The above is a matter of opinion provided for general information purposes only and is not intended as investment advice. Information and analysis above are derived from sources and utilising methods believed to be reliable, but we cannot accept responsibility for any losses you may incur as a result of this analysis. Individuals should consult with their personal financial advisors.
© 2005-2022 http://www.MarketOracle.co.uk - The Market Oracle is a FREE Daily Financial Markets Analysis & Forecasting online publication.