


Are Crude Oil's Bears Over?
Commodities / Crude Oil Nov 17, 2014 - 10:02 PM GMTBy: Nadia_Simmons

 Trading position (short-term; our opinion): Long positions with a stop-loss at $72.78 are justified from the risk/reward perspective.
Although crude oil hit a fresh four-year low on Friday, the commodity rebounded sharply as upbeat U.S. data and speculations that OPEC countries may consider cutting output supported the price. As a result, light crude closed the day above $75 and invalidated the breakdown below important support lines. Is it enough to trigger a trend reversal?
On Friday, the Census Bureau reported that U.S. retail sales rose 0.3% last month, beating expectations for a 0.2% gain, while core retail sales (without automobiles) increased by 0.3% in October. Additionally, the University of Michigan reported that its consumer sentiment index climbed to a more than seven-year high of 89.4 this month beating analysts'expectations for a rise to 87.5. These bullish numbers supported the price fueling hopes that the world's largest economy is gaining steam and will consume more fuel and energy. Additionally, speculations that OPEC countries may consider cutting output supported the commodity as well. In this environment, light crude bounced off a four-year low and climbed above $75. Are there any other positive technical signals that could drive crude oil higher? (charts courtesy of http://stockcharts.com).
On Friday, we wrote the following:
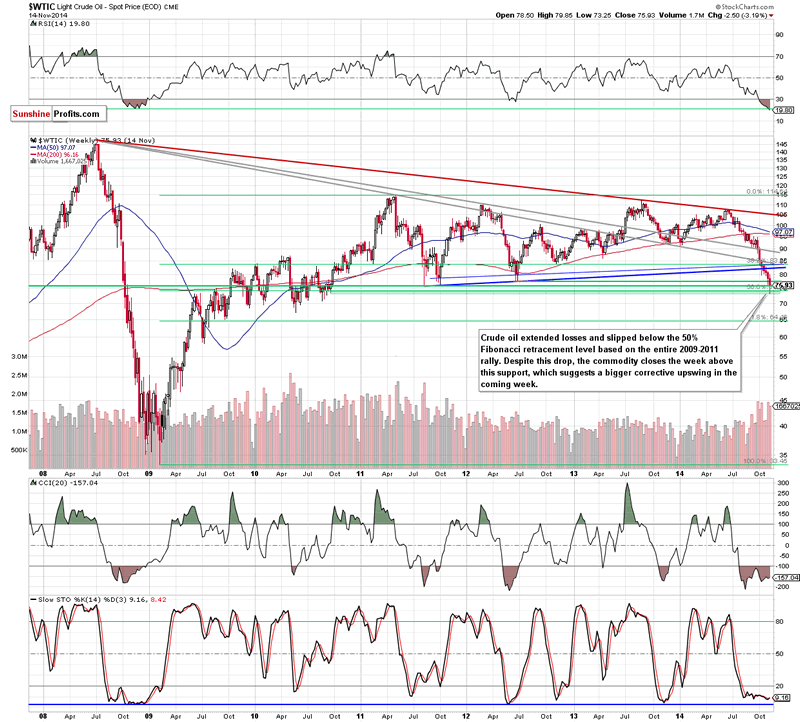
(...) even if we see another drop, the most important factor that could influence future's moves will be the weekly closing price. The reason? If we see a breakdown under the 50% Fibonacci retracement, it would be a strong bearish sign, which could trigger further deterioration - even to around $70, where the next psychological barrier and the Aug 2010 low are. On the other hand, if the commodity invalidates the breakdown below this key support, closing above $74.20, it would be a bullish signal, which could signal a trend reversal.
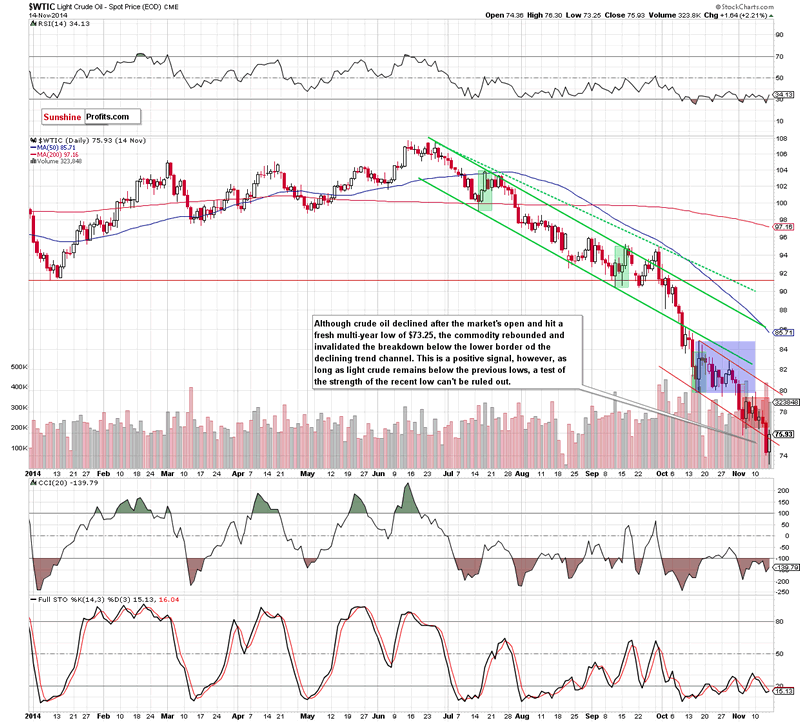
Looking at the above charts, we see that although crude oil slipped below the 50% Fibonacci retracement after the market's open and hit a fresh four-year low of $73.25, the commodity reversed and rebounded sharply in the following hours. With this upswing, light crude came back above this key support level and invalidated a breakdown below the lower border of the declining trend channel (seen on the daily chart). These are strong bullish signals (especially when we factor in the fact that crude oil closed the previous week above $74.20), which suggests further improvement in the coming week. Nevertheless, as long as the commodity remains under the previous lows and the barrier of $80 another test of the strength of the 50% Fibonacci retracement and the recent low can't be ruled out.
Summing up, the most important event of Friday's trading day was another breakdown below the 50% Fibonacci retracement and its quick invalidation in the following hours. As we have pointed out before, this is a positive signal (especially when we factor in the fact that crude oil closed the previous week above it), which suggests further improvement in the coming week even if crude oil re-test the strength of this key support level.
Very short-term outlook: bullish
Short-term outlook: mixed with bullish bias
MT outlook: mixed
LT outlook: bullish
Trading position (short-term; our opinion): Long positions with a stop-loss at $72.78 are justified from the risk/reward perspective.
Thank you.
Nadia Simmons
Sunshine Profits‘ Contributing Author
Oil Investment Updates
Oil Trading Alerts
* * * * *
Disclaimer
All essays, research and information found above represent analyses and opinions of Nadia Simmons and Sunshine Profits' associates only. As such, it may prove wrong and be a subject to change without notice. Opinions and analyses were based on data available to authors of respective essays at the time of writing. Although the information provided above is based on careful research and sources that are believed to be accurate, Nadia Simmons and his associates do not guarantee the accuracy or thoroughness of the data or information reported. The opinions published above are neither an offer nor a recommendation to purchase or sell any securities. Nadia Simmons is not a Registered Securities Advisor. By reading Nadia Simmons’ reports you fully agree that he will not be held responsible or liable for any decisions you make regarding any information provided in these reports. Investing, trading and speculation in any financial markets may involve high risk of loss. Nadia Simmons, Sunshine Profits' employees and affiliates as well as members of their families may have a short or long position in any securities, including those mentioned in any of the reports or essays, and may make additional purchases and/or sales of those securities without notice.
© 2005-2022 http://www.MarketOracle.co.uk - The Market Oracle is a FREE Daily Financial Markets Analysis & Forecasting online publication.