Gold Price Crash Through Key Support, Crude Oil in Freefall
Commodities / Gold and Silver 2014 Nov 03, 2014 - 04:36 AM GMTBy: Clive_Maund
 Gold finally crashed key support at last year's lows on Friday, which was a very bearish development that has opened up the prospect of an immediate severe decline at least to the strong support in the $1,000 area. Such a decline will have grave consequences for the Precious Metals mining industry, whose costs have risen sharply in recent years, and is expected to lead to a massive wave of company failures, as many who have been "hanging on by their fingernails" finally lose the fight and disappear over the cliff. This will eventually lead to an acute gold supply shortage, which will be exacerbated after the dollar's deflation panic "swan song" rally is done, and the dollar is then pushed off its perch as the global reserve currency by the actions of China and Russia (and others) working in concert to bring it down. This will lead to a massive resurgence in gold and silver and to the stocks of mining companies who weather the imminent Great Cull going ballistic.
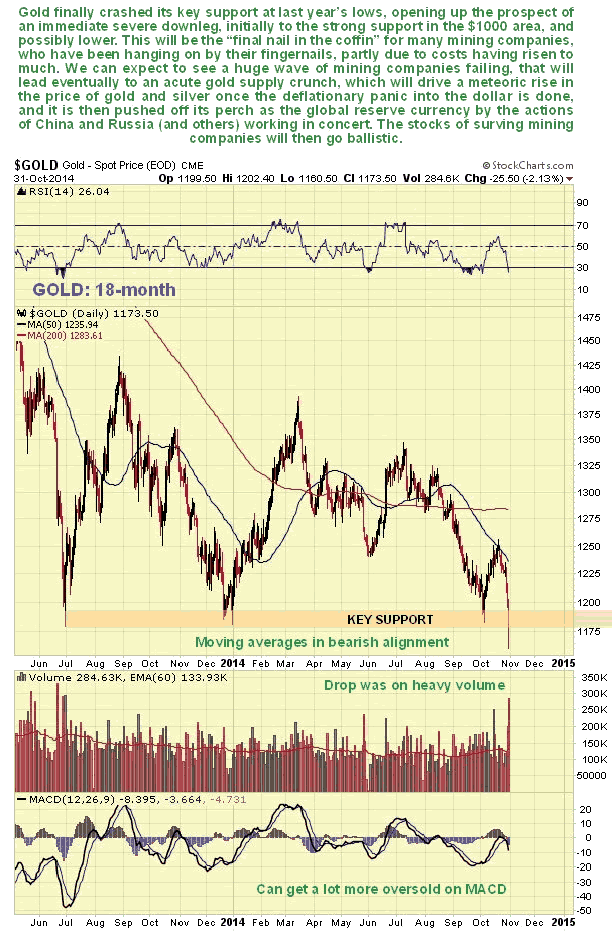
That's all in the future - the immediate prospects are grim. We will now review the charts, starting with gold's 18-month chart. On this chart we can see the decisive breakdown on Friday, on the heaviest volume for well over a year. This breakdown was a very bearish development that is expected to lead to a steep drop in the face of a continuing rise in the dollar, as money panics out of Europe and other trouble spots, seeking safe haven. Before leaving this chart note the bearishly aligned moving averages and the fact that gold is not yet very oversold on its MACD - it can get a lot worse than this and looks set to.
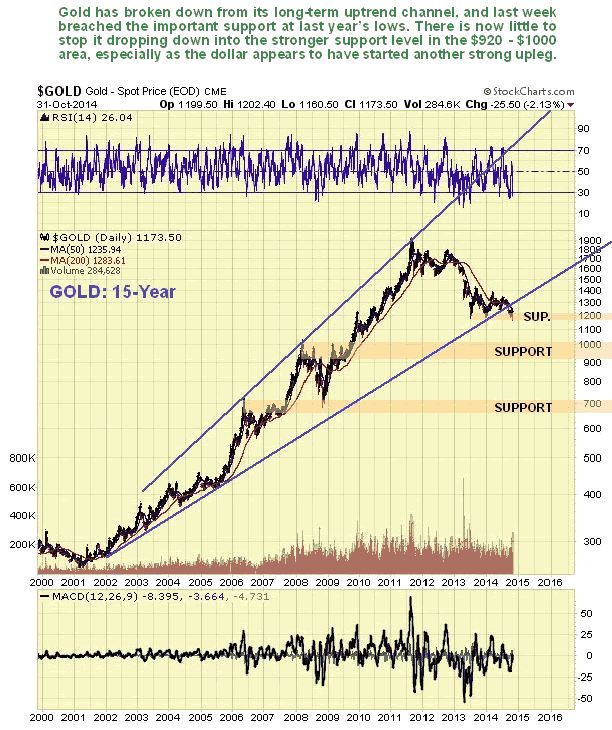
On its 15-year chart we can see that, unlike silver, gold broke down from its major long-term uptrend a while back, a bearish development that has now been compounded by the aforementioned support failure, and confirmed by silver breaking down from its long-term uptrend just last week. There can now be no illusions that the long-term bullmarket is intact - not until the dollar tops out, that is. No serious support comes into play until gold has dropped into the $1000 area - that is where it now appears to be headed, and with the dollar uptrend resuming it could get there fast, with some chance of it going even lower.
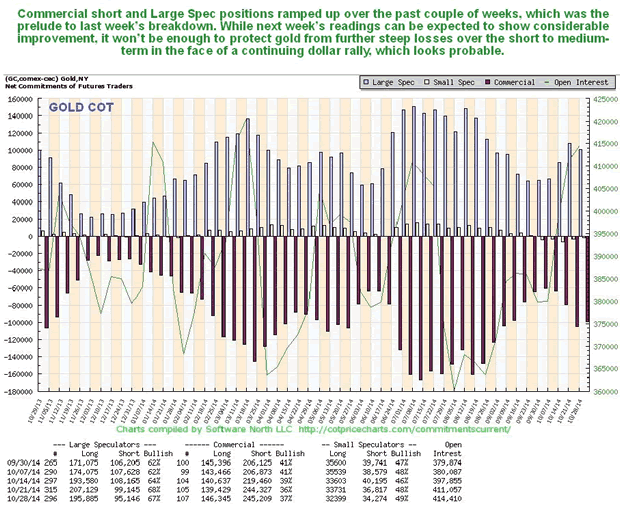
Gold's latest COT doesn't look too bad, it is in middling ground, but we can see the bearish buildup in Commercial short and Large Spec long positions over the past several weeks that lead to last week's breakdown.
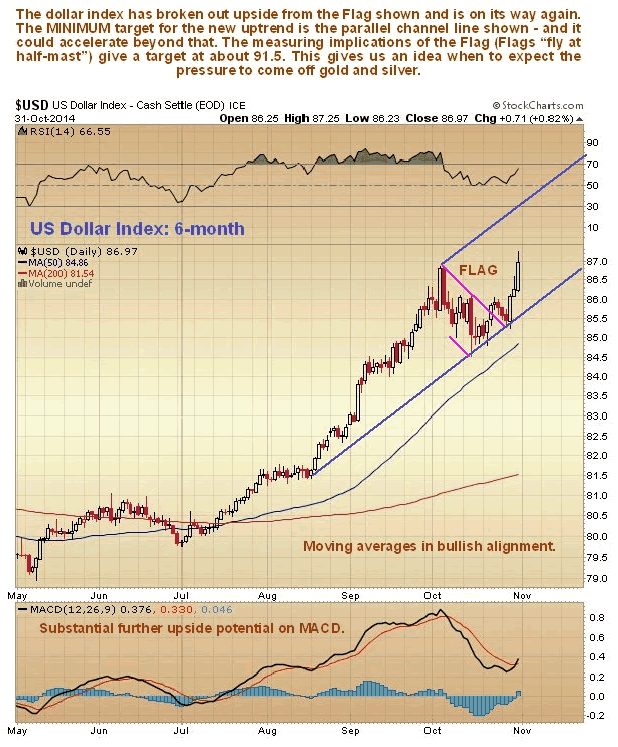
Gold's breakdown on Friday was triggered by the dollar rally resuming and it breaking out to new highs on Friday, as we can see on the 6-month chart for the dollar index shown below. The dollar's renewed advance follows the successful completion of a small Flag consolidation. This Flag has measuring implications - these Flags tend to "fly at half mast", meaning that the advance following a Flag is usually of the same magnitude as the advance that preceded it. This gives us a target for the rally in the dollar index at about 91.5 minimum. This is where we should assess the damage to gold with a view to figuring whether it has hit bottom or not.
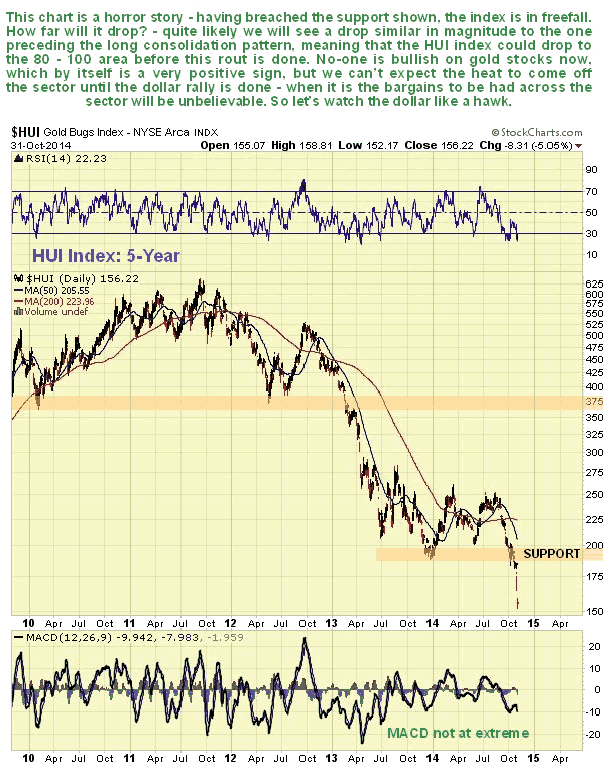
Despite already being monstrously oversold relative to bullion, gold stocks were "taken to the woodshed" yet again last week as a result of gold and silver breaking lower, and suffered further heavy losses, as we can see on the 5-year chart for the HUI index shown below. They are now in freefall, and clearly, if gold now drops to its big support in the $1,000 area, they can be expected to continue to plummet, and it is reasonable to expect to see a downleg of similar magnitude to the one that lead into the big consolidation pattern of the past 15-months.
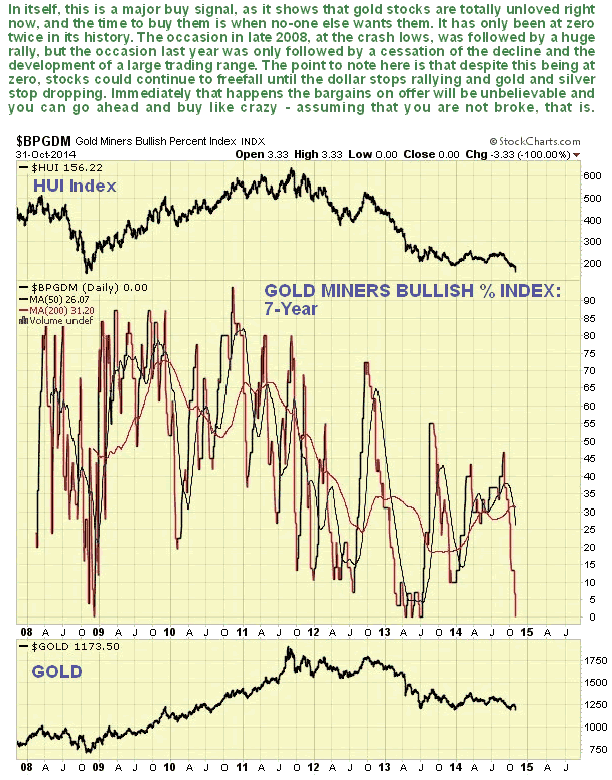
Although the immediate outlook is awful, we should keep in mind that the all-pervasive negativity towards the sector is a sign that a major bottom is not too far over the horizon. Firm evidence of that is provided by the 7-year chart for the Gold Miner's Bullish Percent Index. This shows a truly extraordinary situation where, already, no-one is bullish in the sector. This is the "dry tinder" for an explosive rebound immediately the market senses that the bottom is in. The prolonged rotten performance of stocks relative to bullion is a reminder that we can expect stocks to front run the bottom in the metals. On only two occasions in the life of this chart have we seen such an abysmally low reading in this index. One was the 2008 general market panic low, which was followed by a huge rally in the Precious Metals sector lasting several years into the 2011 top, and the other, in the Summer of last year, was followed by a bounce and then the development of the long trading range that preceded last week's breakdown.
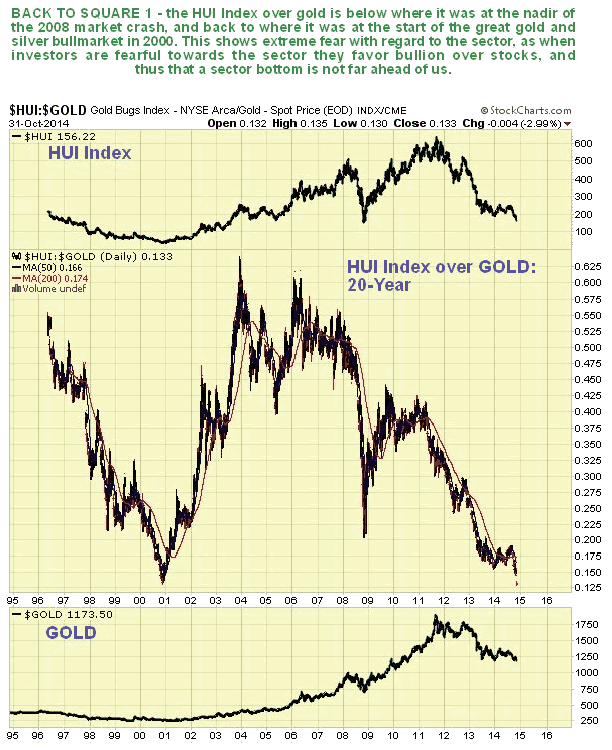
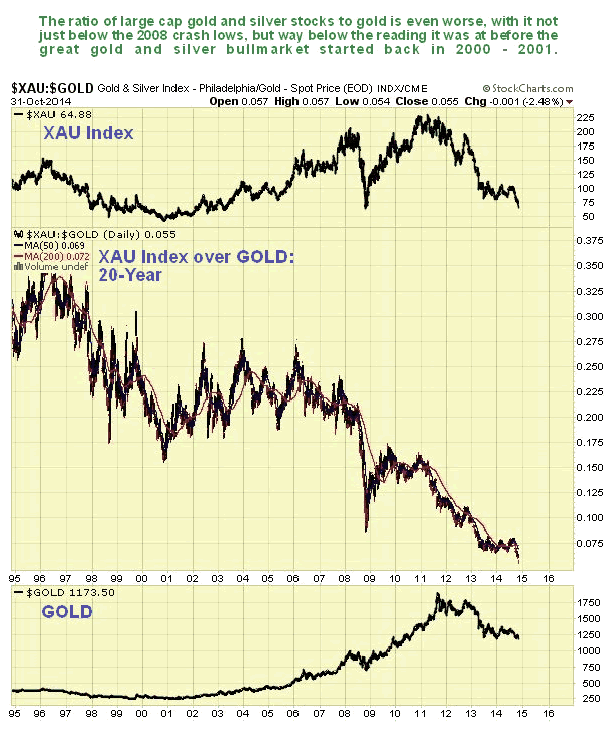
Just how horribly oversold stocks are relative to bullion is made plain by the following two charts, which show first the HUI index over gold, and then the large stock XAU index over gold, which is even worse. To understand what this means, you have to realize that when investors are fearful towards this sector they favor bullion over stocks, because while companies can and do go bust, gold bullion always survives, whatever its price in fiat. The more fearful they are towards the sector, the lower these ratios go, and as we can see, they are considerably more fearful towards the sector than they were at the 2008 crash low, and with respect to the HUI Index over gold ratio, they are as fearful towards the sector as they were in late 2000, before the great bull market in gold and silver began, and much more so with respect to large cap stocks, as shown by the XAU index over gold ratio, whose reading is much lower than in late 2000. These are clearly extremes of fear that have major bullish implications. What it means is that once the dollar's swan song deflation rally is done, we are likely to see a humongous recovery in gold and silver stocks, magnified by the fact that many companies will have already "gone to the wall" by the time it happens.
In conclusion it appears what we are about to witness is the sector collapse into the final low, before a recovery that promises to be amazingly robust. This collapse will trigger an industry wide cull and cleanout. It will be like the Black Death with bodies being taken away by the cartload, but the companies that pull through this terrible time can look forward to the prospect of an extraordinary resurgence in fortunes, and a correspondingly big increase in their share prices. Those of you who have any capital left should make sure you don't miss out on this.
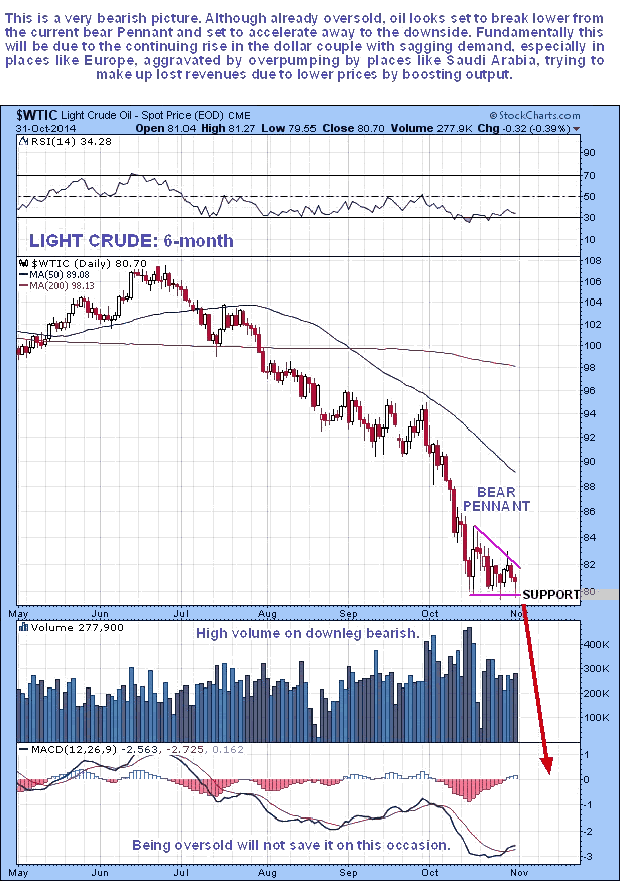
We are going to end with a sideways look at what is going on in oil, which looks to break down imminently from the bear Flag that has been forming in recent weeks. It looks set to crash major support and plummet, and in part this will of course be due to the continued rise in the dollar.
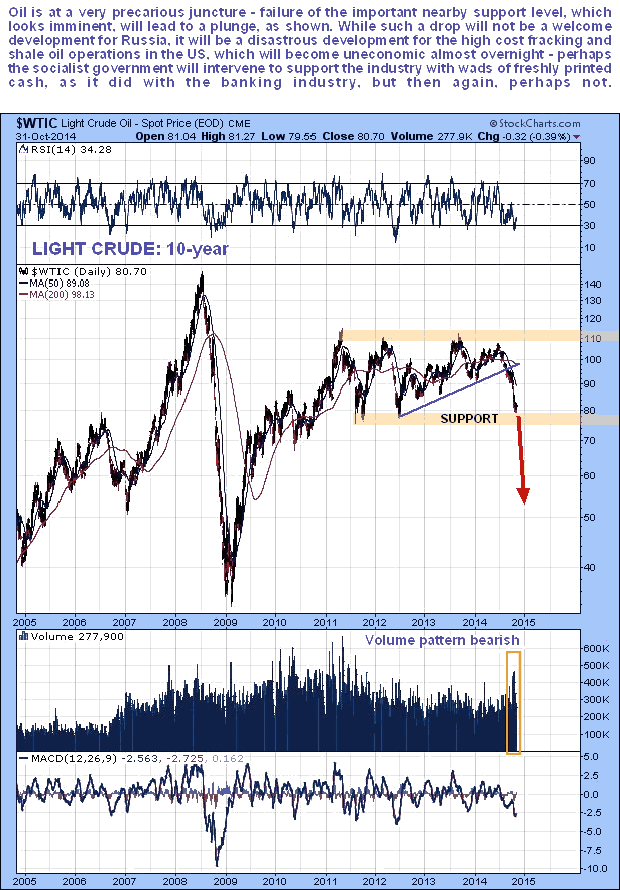
While US elites are doubtless chortling with mirth at the thought of the squeeze being put on Putin and Russia by the falling oil price, they will be laughing on the other side of their faces when they realize what this means for the US fracking and oil shale energy boom. For Russia, the falling oil price is not the end of the world - they will sell their oil but get a lower price, but for the high cost fracking and oil shale operations in the US, a big drop in the price of oil is disastrous, as it will quickly make them uneconomic and force them to shut down operations.
Our 6-month chart for West Texas Light Crude shows a tight completing bear Flag or Pennant, breakdown from which looks imminent. A breakdown from this pattern is expected to lead to another sharp drop that could be much worse than the one early in October.
The reason it may be much worse becomes clear when we look at the 10-year chart. On this chart we see that breakdown from the Flag/Pennant is likely to lead to oil crashing support at its 2010 and 2011 lows. It could easily plummet from here, back to the $50 - $60 area or even lower. Fundamentally the reason for such a drop would be a combination of a higher dollar with sagging demand in recession wracked places like Europe, and overpumping by places like Saudi Arabia anxious to make good revenue shortfalls by ramping up output.
On the site we will look at a way to capitalize on the anticipated steep drop in the price of oil, that is believed to be imminent.
By Clive Maund
CliveMaund.com
For billing & subscription questions: subscriptions@clivemaund.com
© 2014 Clive Maund - The above represents the opinion and analysis of Mr. Maund, based on data available to him, at the time of writing. Mr. Maunds opinions are his own, and are not a recommendation or an offer to buy or sell securities. No responsibility can be accepted for losses that may result as a consequence of trading on the basis of this analysis.
Mr. Maund is an independent analyst who receives no compensation of any kind from any groups, individuals or corporations mentioned in his reports. As trading and investing in any financial markets may involve serious risk of loss, Mr. Maund recommends that you consult with a qualified investment advisor, one licensed by appropriate regulatory agencies in your legal jurisdiction and do your own due diligence and research when making any kind of a transaction with financial ramifications.
Clive Maund Archive |
© 2005-2022 http://www.MarketOracle.co.uk - The Market Oracle is a FREE Daily Financial Markets Analysis & Forecasting online publication.


