Will Utilities Continue to Drive Market Performance?
Companies / US Utilities Nov 01, 2014 - 11:40 AM GMTBy: Investment_U
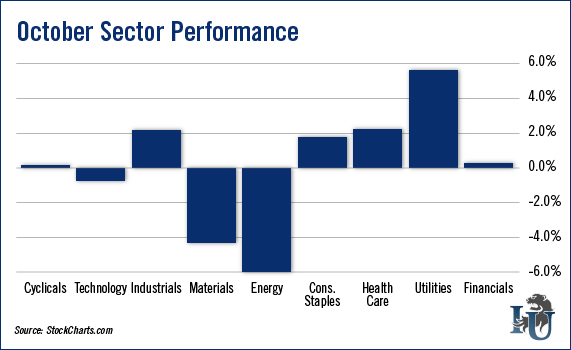
 David Becker writes: Surprisingly, the rebound in stock prices at the end of October has been driven by the defensive sectors. The utility sector has been the best performer, notching up gains of nearly 6% during the first 21 trading days of October. The question for investors is: Can utilities continue to lead the broader markets higher in the last two months of 2014?

Historically, investors have purchased utilities shares for their robust dividends as protection against stock price drops. Generally, you would expect the demand for utility shares to decline when sentiment is strong, but this has not been the case.
Investor confidence was very strong in October. On Tuesday, the Conference Board reported that U.S. consumer confidence surged to a 94.5 in October, which is a seven-year high. The Conference Board’s survey confirmed the Michigan sentiment index survey, which rose to an 86.4 in October, hit a 15-month high.

The increase in consumer sentiment came just as stock prices started to whipsaw in October. Historically, utilities have lagged the performance of the broader market when stocks are performing well.
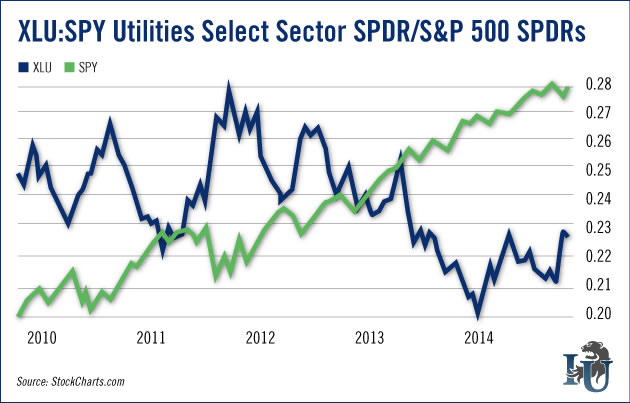
The chart of the ratio between the Utilities Select Sector SPDR (NYSE: XLU) and the SPDR S&P 500 ETF (NYSE: SPY) measures the performance of the ratio relative to price of the SPDR S&P 500 ETF. This visual display shows that the spread usually declines when the broader market is rising. This means that the returns of the utility sector generally lag the returns of the S&P 500 during good times. If fact, since bottoming in July 2010, the SPDR S&P 500 ETF has increased by 112%, while the ratio between the Utilities Select Sector SPDR and the SPDR S&P 500 ETF has declined by 18%.
So what has led to the outperformance of the utility sector in October? It has been a combination of factors, which include increasing volatility and declining Treasury yields. Volatility increased significantly during the first half of October. Implied volatility, which is how much investors think the market will move, surged to 30%, the highest level seen since July 2012. The increase was likely in part due to increased anxiety over the infiltration of the Ebola virus into major cities in the United States.
Stock prices tumbled during the first two weeks of October. This coincided with a decline in U.S. 10-year yields, which tumbled to 1.86%, the lowest trading level since February 2013. With yields, below 2%, investors flocked to higher-yielding assets such as utility shares.
Despite the outperformance of the utility sector in October, November and December are not good periods to invest in the utility sector. Seasonally, the utility sector underperforms the broader markets in the last two months of the year. For example, over the past 16 years, the returns of the Utilities Select Sector SPDR have been lower than the returns of the SPDR S&P 500 ETF by an average of 0.8% in November, 75% of the time. In December, the Utilities Select Sector SPDR has underperformed the SPDR S&P 500 ETF by an average of 0.4%, 60% of the time.
Copyright © 1999 - 2014 by The Oxford Club, L.L.C All Rights Reserved. Protected by copyright laws of the United States and international treaties. Any reproduction, copying, or redistribution (electronic or otherwise, including on the world wide web), of content from this website, in whole or in part, is strictly prohibited without the express written permission of Investment U, Attn: Member Services , 105 West Monument Street, Baltimore, MD 21201 Email: CustomerService@InvestmentU.com
Disclaimer: Investment U Disclaimer: Nothing published by Investment U should be considered personalized investment advice. Although our employees may answer your general customer service questions, they are not licensed under securities laws to address your particular investment situation. No communication by our employees to you should be deemed as personalized investment advice. We expressly forbid our writers from having a financial interest in any security recommended to our readers. All of our employees and agents must wait 24 hours after on-line publication or 72 hours after the mailing of printed-only publication prior to following an initial recommendation. Any investments recommended by Investment U should be made only after consulting with your investment advisor and only after reviewing the prospectus or financial statements of the company.
Investment U Archive |
© 2005-2022 http://www.MarketOracle.co.uk - The Market Oracle is a FREE Daily Financial Markets Analysis & Forecasting online publication.


