


Stock Market Intermediate Correction Underway
Stock-Markets / Stock Markets 2014 Oct 27, 2014 - 10:03 AM GMTBy: Andre_Gratian

 Current Position of the Market
SPX: Long-term trend - Bull Market
Intermediate trend - Intermediate correction (primary wave IV) underway.
Analysis of the short-term trend is done on a daily basis with the help of hourly charts. It is an important adjunct to the analysis of daily and weekly charts which discusses the course of longer market trends.
ARE WE STILL IN WAVE B OF PRIMARY IV?
Market Overview
Monday and Tuesday of last week SPX continued to rally sharply, but for the rest of the week the advance slowed materially, even though we closed the week at the rally high. The deceleration pattern which takes the form of a wedge is best seen on the hourly chart which we will analyze later.
Most indices have retraced about .618 or less of their declines, which puts them at a potentially vulnerable level where they could end their retracement. SPX met with some selling when it reached that point but has since gone a little beyond. The Dow Transport is the strongest index with an 84% retracement, followed by the QQQ with about 80%.
It could be argued that after a 200-point correction, wave IV has approximated wave II (250 points) in size if not in time and that we are now in wave V of the bull market. The problem with this theory is that 250 points of wave II represented a correction which exceeded 40% of primary I. The current correction, besides consuming a minuscule amount of time, also only amounted to 20% of wave III.
Next week could give us some clue about where we go from here. Let's see where we stand.
Momentum: The strong rally of the SPX has only managed to arrest the decline of its weekly MACD. The daily MACD turned up from approximately -30 and is still a negative -10. As for the hourly, it made its peak on Wednesday and has been in a very slow decline since.
Breadth: The McClellan Oscillator has risen to the top of its overbought level and is therefore vulnerable to a correction. Its action has lifted the Summation Index off its low, but it is still deeply negative, although it will continue to recover if the oscillator remains positive.
Structure: The strength of the rally has raised some questions as to whether primary wave IV is already complete and if we are already in wave V. Short-term, the rally from 1820 appears to be finishing with an ending diagonal pattern which could be forecasting the end of wave B of primary wave IV. What we do from here will decide the course SPX wishes to follow.
Accumulation/distribution: Although there are potential counts that are much lower, if primary wave IV is complete, we will have to satisfy ourselves with the 1820 price objective as the low of the correction.
Cycles: It is possible that the current decline was only the work of the 4-year cycle and that the low of the long-term Kress cycle is still ahead of us.
Chart Analysis
Our first chart will again be that of the weekly SPX (chart courtesy of QCharts) with the McClellan Summation Index posted underneath it.
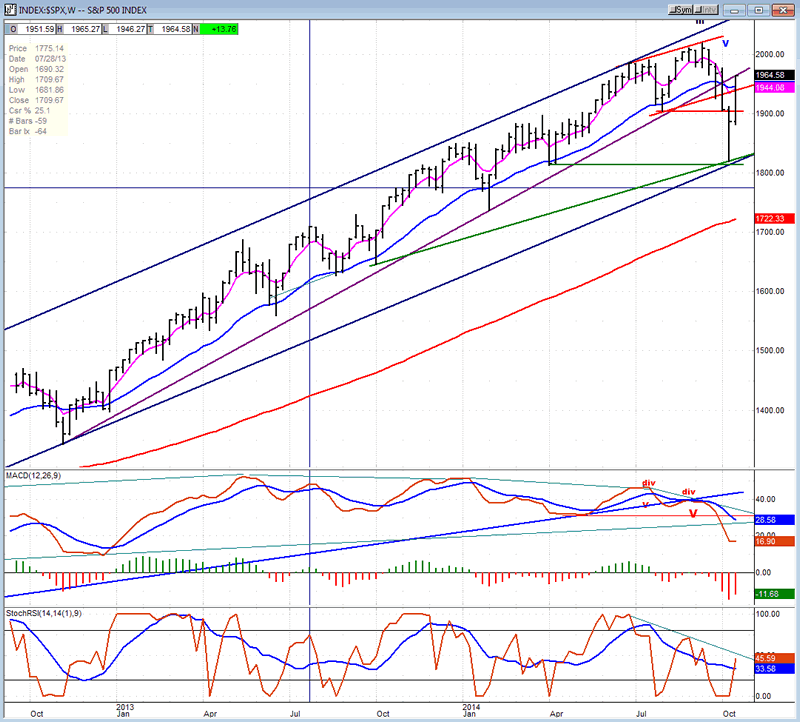
You can see that our impressive rally has done little to lift the oscillators significantly. This is because it happened very fast. If we continue to remain in an uptrend, even if we simply mark time, we should see the oscillators continue to rise (in the case of the Summation Index that will happen only if the McClellan oscillator remains positive).
As for the price, after finding support on the trend line for primary wave III (from October 2011), it has now rallied all the way to back-test the broken trend line from 1343. Actually, while the support and resistance appear to be touched at the bottom and at the top on the weekly chart, the daily chart shows that there was a little room left at the bottom, just as there is still a little space at the top. The resistance provided by the broken trend line could be a good place for the rally to end. We'll see!
Incidentally, another reason to think of the rally only as wave B is that it is customary for wave four to go outside of the wave three trend line before the wave is complete.
Looking at the daily chart (also courtesy of QCharts.com) we can see that SPX could rise another couple of points to back-test the broken trend line from 1343. It is also evident that it is entering an area of strong resistance which is provided by the various dashed trend lines above. It is no wonder that it is losing upside momentum as it enters this price range, something that will be better seen on the hourly chart.
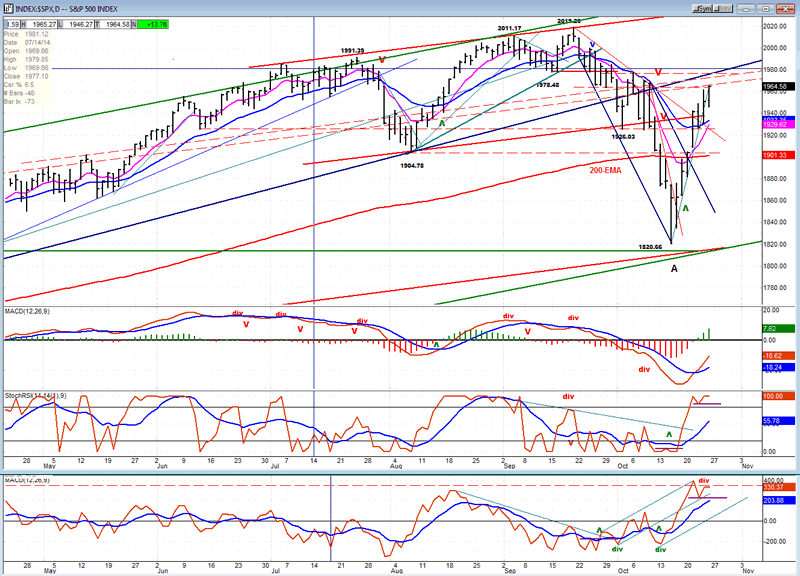
The two lower oscillators are overbought and the bottom one (A/D) is already displaying some mild negative divergence, while the middle one has gone as far as it can and could remain in that condition as long as the price does not correct. As for the MACD, it is still negative but has made a bullish cross and its histogram is still making higher highs, which means that it is accelerating upward. That tells us that SPX is not likely to turn on a dime tomorrow.
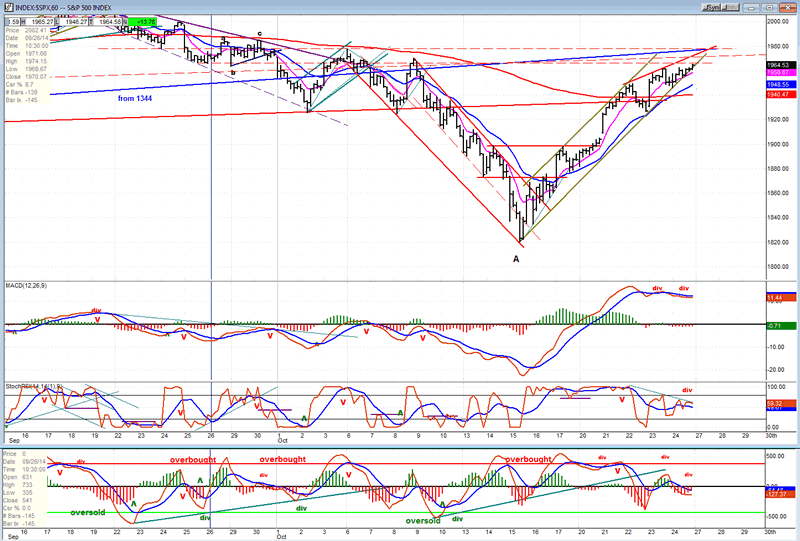
As mentioned previously, the hourly chart is where we can observe the significant deceleration which has taken place over the last couple of days in the index's upward momentum. The pattern being formed is that of an ending diagonal, with the price angling toward the bottom trend line of the uptrend channel. This deceleration is taking place even before the index has reached the resistance zone and the broken trend line from 1344, resulting in some severe negative divergence in all three oscillators -- a condition which normally precedes a retracement in the price.
Sentiment Indicators
With the rally in equities, the SentimenTrader (courtesy of same) long term indicator has moved back to 50 -- a reading which is neutral and does not carry any particular future trend implication.

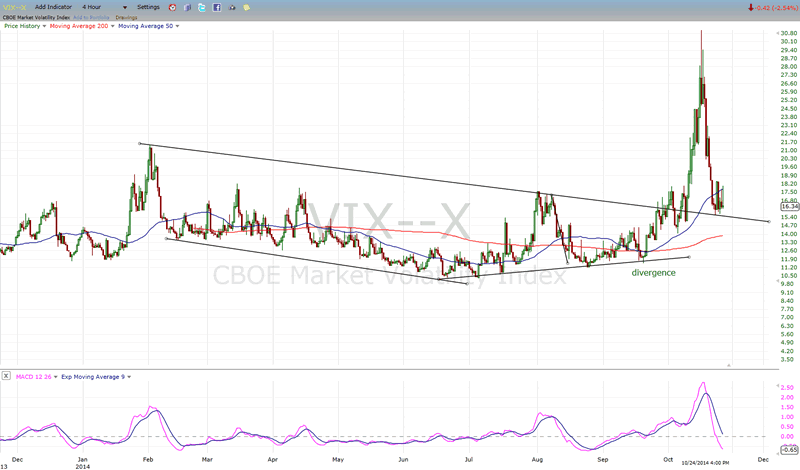
VIX (NYSE Volatility Index) - Leads and confirms market reversals.
VIX had a sharp rally while the market was correcting and retraced just as fast when indices rebounded.
For now, at least, it reflects the volatility of the market but, from a technical point of view, what it has done is perfectly logical. It has back-tested the top channel line from which it has broken out, and is consolidating above that trend line. Note also, that the consolidation which is now three days old has formed a flat bottom while the SPX has moved higher during that time period. This is the type of positive divergence to the market that it exhibited prior to its break out. Let's see if it has the same implication for the market trend over the next few days.
IWM (iShares Russell 2000) - Historically a market leader.
IWM has started a downtrend which is still in effect since it is still trading inside its declining channel. The rally stalled after back-testing its broken long-term trend line. 111 was also the short-term projection indicated by the P&F chart (at least for the near-term, and perhaps longer). Let's see if it can alter its current bearish pattern.

TLT (20+yr Treasury Bond Fund) - Normally runs contrary to the equities market.
In a surge which coincided with the market decline, TLT reached the top of an expanded channel and has retraced sharply with the market rally, finding support at a previous resistance line which it had overcome during its exuberant move. If it consolidates above that line, it would also be a sign that the market rally has stalled and that we should be prepared for the B wave of the correction to reach completion.

GLD (ETF for gold) - runs contrary to the dollar index.
GLD's rally may be over. It could not go through its MA and could now continue its decline toward the low of its 25-wk cycle low (green arrow) which is due around mid-November.

UUP (dollar ETF)
UUP may have a little more work to do to complete its wave 4 from the low of the channel, athough it could already be complete and its fifth wave may already have started. A move beyond 23.50 could triger a long-term trend which could eventually reach 27-28. At least this is implied by the P&F base that was recently constructed. If this projection is correct, we can expect much lower prices in GLD and USO as a result.

USO (US Oil Fund) - following chart courtesy of QCharts.com.
USO is undergoing a consolidation in a downtrend in preparation for a move lower while UUP completes its fifth wave.

Summary
After a strong rally which caused the SPX to retrace a little over 70% of its 200-point decline, significant deceleration appears to be setting in. If primary wave IV is still in progress, this could mean that we are now close to the peak of its B wave with the bulk of the rally behind us. That does not mean that we are ready to reverse immediately. We could be entering a period of distribution which could still see slightly higher prices.
The unlikely alternative is that primary wave IV is already complete and that wave V has started.
FREE TRIAL SUBSCRIPTON
If precision in market timing for all time framesis something that you find important, you should
Consider taking a trial subscription to my service. It is free, and you will have four weeks to evaluate its worth. It embodies many years of research with the eventual goal of understanding as perfectly as possible how the market functions. I believe that I have achieved this goal.
For a FREE 4-week trial, Send an email to: ajg@cybertrails.com
For further subscription options, payment plans, and for important general information, I encourage
you to visit my website at www.marketurningpoints.com. It contains summaries of my background, my
investment and trading strategies, and my unique method of intra-day communication with
subscribers. I have also started an archive of former newsletters so that you can not only evaluate past performance, but also be aware of the increasing accuracy of forecasts.
Disclaimer - The above comments about the financial markets are based purely on what I consider to be sound technical analysis principles uncompromised by fundamental considerations. They represent my own opinion and are not meant to be construed as trading or investment advice, but are offered as an analytical point of view which might be of interest to those who follow stock market cycles and technical analysis.
Andre Gratian Archive |
© 2005-2022 http://www.MarketOracle.co.uk - The Market Oracle is a FREE Daily Financial Markets Analysis & Forecasting online publication.