Do Tumbling Buybacks Signal Another Stock Market Crash?
Stock-Markets / Financial Crash Oct 26, 2014 - 08:47 PM GMTBy: Mike_Whitney
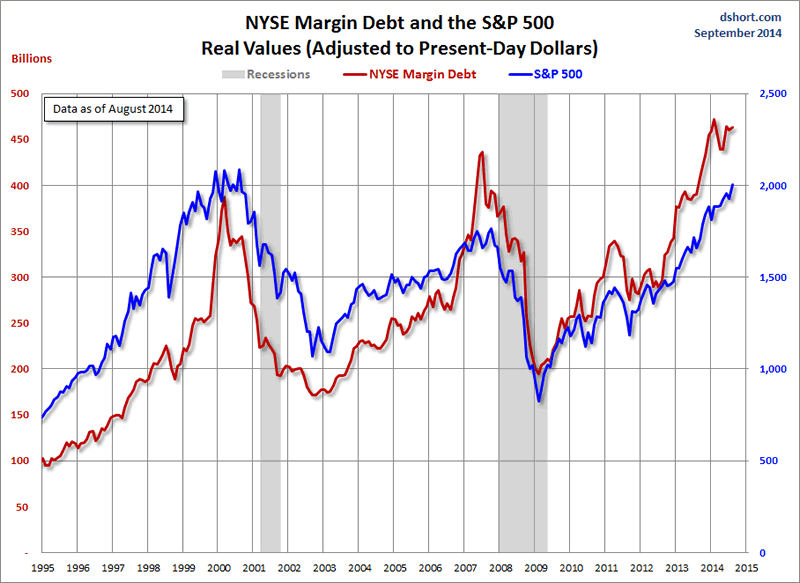
 Since the end of the recession in 2009, investors have borrowed a record amount of money to finance their stock acquisitions. According to the Financial Times, margin debt on the New York Stock Exchange (NYSE) peaked in February, 2014 at $466 billion and has only recently dipped slightly lower. That’s $85 billion more than 2007 at the peak of the bubble. (Below: Margin debt tends to trace the trajectory of the markets fairly closely, although it’s a poor indicator of a market “top”.)

NYSE Margin Debt drifts higher in August, ETF Daily News
When stocks start see-sawing like they did last week, it’s usually a sign that over-extended investors are dumping their stocks to meet margin calls. The same thing happened in the run-up to the Crash of 1929. Stocks dropped sharply in late October which forced deeply-indebted investors to unload their holdings at firesale prices. The falling prices triggered a panic that sent stocks into freefall wiping out billions of dollars, crashing the markets, and paving the way for the Great Depression. Here’s a brief summary of what happened:“On September 3, the market dropped sharply only to rise and then drop again. It was like tremors before a big earthquake but nobody heeded the warning. The market had sagged temporarily before, but it always came back stronger. The market dipped sharply again on October 4 (and) October 21 saw an avalanche of selling as many tried to salvage something from their loss. On October 24 — Black Thursday — the panic took on a life of its own as selling orders overwhelmed the Exchange’s ability to keep up with the transactions…Wall Street financiers tried to inspire confidence by buying as many shares as they could. It worked — temporarily. (But) on Monday the panic started again, and then came Black Tuesday — October 29. The panic on the Exchange floor changed to bedlam. According to one observer, “They hollered and screamed, they clawed at one another’s collars. It was like a bunch of crazy men. Every once in a while … you’d see some poor devil collapse and fall to the floor.” This was the Crash, although few could see it at the time… Thirty billion dollars had been lost — more than twice the national debt. The nation reeled, and slipped into the depths of the Great Depression. ” (The Wall Street Crash, 1929, Eyewitness to History)Unsurprisingly, the banks were at the center of that fiasco too, as was their principle agent, the Federal Reserve. In fact, the International Monetary Fund just issued a scathing rebuke of the Fed’s policies saying that zero rates, which have been in effect for over 5 years, have put the financial system at risk again. Here’s more on the IMF report from the Guardian:
“Accommodative policies aimed at supporting the recovery and promoting economic risk taking have facilitated greater financial risk taking,” the IMF said. As evidence it pointed to rising asset prices, smaller premiums on riskier investments and the lack of volatility in financial markets…”
The IMF said there was a trade-off between the upside economic benefits of low interest rates and the money creation process known as quantitative easing and the downside financial stability risks… “market and liquidity risks have increased to levels that could compromise financial stability if left unaddressed.” (IMF warns period of ultra-low interest rates poses fresh financial crisis threat, Guardian)
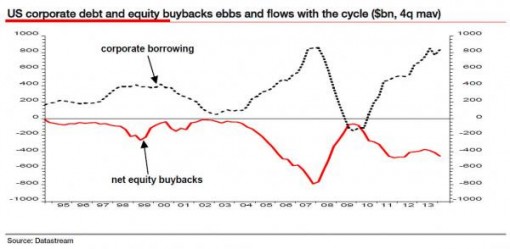
In other words, fixing the price of money at zero for years-on-end, increases financial instability while doing nothing for the real economy. The IMF is basically admitting that the Fed has created the conditions for another meltdown.And the excessive risk taking is not limited to margin debt either. It’s visible in financial assets across the board. Take stock buybacks, for example. Buybacks, which add nothing to a company’s productivity or real value, merely juice stock prices so shareholders and executives can cream bigger profits for themselves. What most people don’t know about buybacks is that the fatcat corporate bosses are not recycling profits into share purchases, but taking advantage of the low rates to load on more debt. Check out this eyepopping chart at Zero Hedge which shows the lethal symmetry between corporate borrowing and stock buybacks:

(The Buyback Party Is Indeed Over: Stock Repurchases Tumble In The Second Quarter, Zero Hedge)
Why is this happening?It’s happening because the Obama administration reduced the budget deficits thereby choking off the fiscal stimulus the economy needs to grow. That bit of belt-tightening weakened overall demand forcing corporations to look for other ways to boost profits. What many CEOs figured out was that they could increase earnings by cutting costs and shedding workers while, simultaneously, goosing stock prices by taking advantage of the low interest rates and adding more debt. This is the strategy that energized the stock buyback craze, the revenue-shrinking, worker-trimming, industry-gutting plan to enrich the few at the expense of the company, its employees and its future. Check this out from the WSJ:
“Preliminary data showed stock buybacks reached $116.2 billion in the second quarter … down 27% from $159.3 billion recorded for the first quarter of this year, the second highest on record.
For the 12 months ended June, companies raised their stock repurchases to $533 billion, an increase of nearly 27% from a year earlier. Meanwhile, combined buyback and dividend expenditures for the period reached a record of $865.9 billion, with buybacks representing 61.6% of the total.” (Companies reduced stock buybacks in 2nd quarter, Wall Street Journal)
So you want to know why stocks keep soaring higher on so-so economic data?Buybacks, that’s why. Here’s a clip from an earlier article in the WSJ that underscores the magnitude of the flimflam:
“Last year, the corporations in the Russell 3000, a broad U.S. stock index, repurchased $567.6 billion worth of their own shares—a 21% increase over 2012, calculates Rob Leiphart, an analyst at Birinyi Associates, a research firm in Westport, Conn. That brings total buybacks since the beginning of 2005 to $4.21 trillion—or nearly one-fifth of the total value of all U.S. stocks today.” (Will Stock Buybacks Bite Back?, Wall Street Journal)
If buybacks represent 20 percent of the total value of stocks today, then what’s going to happen when conditions change, that is, when QE ends and rates rise?Stocks are going to tumble, right?Right. And if you want to see how destructive this buyback chicanery really is, just check out the details on IBM’s recent earnings debacle. Here’s the story from the New York Times:
“In the first six months of this year, the company spent more than $12 billion … on its own shares … But all these “shareholder friendly” maneuvers have been masking an ugly truth: IBM’s success in recent years has been tied more to financial engineering than actual performance.That became readily apparent Monday morning when the company announced its earnings, missing analysts’ expectations by a wide margin. The stock fell more than 7 percent to $169.10 by the end of the day, below the average price Mr. Buffett paid since he started buying the stock in 2011.The company’s revenue hasn’t grown in years. Indeed, IBM’s revenue is about the same as it was in 2008.But all along, IBM has been buying up its own shares as if they were a hot item. Since 2000, IBM spent some $108 billion on its own shares, according to its most recent annual report. It also paid out $30 billion in dividends. To help finance this share-buying spree, IBM loaded up on debt.While the company spent $138 billion on its shares and dividend payments, it spent just $59 billion on its own business through capital expenditures and $32 billion on acquisitions. …All of which is to say that IBM has arguably been spending its money on the wrong things: shareholders, rather than building its own business.
“IBM’s financials make it self-evident that its stock-rigging strategy is not about value creation through ‘investment,’ ” David A. Stockman, the director of the Office of Management and Budget under President Ronald Reagan… “IBM is a buyback machine on steroids that has been a huge stock-market winner by virtue of massaging, medicating and manipulating” its earnings per share.” (The Truth Hidden by IBM’s Buybacks, Andrew Ross Sorkin, New York Times)
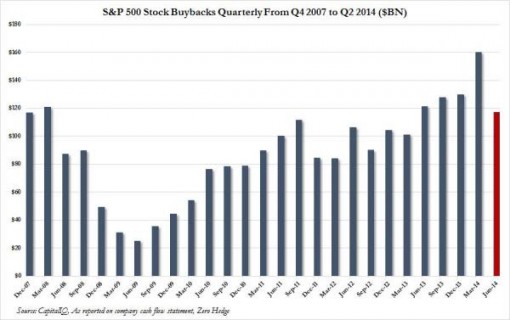
But IBM is no different than anyone else. They’re all doing the same thing; “dissipating corporate assets” and “shrinking their businesses” (Yves Smith) to enrich greedy executives and their voracious shareholders. And who can blame them, after all, these corporations are merely responding to the incentives created by the Fed’s monetary policies. Stock buybacks make perfect sense when credit is easy and the price of money is zero.So why did stock prices plunge last week?It’s all about expectations. Investors know that the conditions that have been favorable for stock buybacks are about to change, (The Fed plans to end QE in October.) so they are making their adjustments while prices are still high. That’s why the markets have been gyrating lately. It’s also why buybacks have dropped by 27 percent in the last quarter. Check out this graph from Zero Hedge:

(The Buyback Party Is Indeed Over: Stock Repurchases Tumble In The Second Quarter, Zero Hedge)
Corporations have been willing to buy their own shares because (a) money is cheap and (b) because they knew the Fed was shrinking the supply of financial assets by buying US Treasuries. Now that the Fed is threatening to turn off the money-spigot, (which will have the same effect as raising rates) the buybacks will slow and stocks will drop. Of course, that’s not the way the analysts at Goldman Sachs see things. They think the slowdown in stock buybacks is just a temporary glitch that coincides with earnings reports. According to Business Insider:
“Goldman Sachs’ David Kostin believes a temporary pullback may explain why the S&P 500 has tumbled from its all-time high of 2,019 on Sept. 19.“Most companies are precluded from engaging in open-market stock repurchases during the five weeks before releasing earnings,” Kostin notes. “For many firms, the beginning of the blackout period coincided with the S&P 500 peak on September 18. So the sell-off occurred during a time when the single largest source of equity demand was absent…
“We expect companies will actively repurchase shares in November and December,” he writes. “Since 2007, an average of 25% of annual buybacks has occurred during the last two months of the year.” (GOLDMAN: We’re Blaming The Stock Market Sell-Off On A Pullback In Buybacks, Business Insider)
Goldman could be right, but I don’t think so, mainly because increased volatility and ructions in the bond market suggest that market dynamics have changed. It’s a whole different ballgame now. “The VIX Volatility Index topped 30 briefly last week — often seen as an unofficial warning sign, while CNNMoney’s own Fear & Greed Index is still in “Extreme Fear” mode with the current reading is 5.” And the troubles in the bond market are even scarier. Check this out on Bloomberg:
“Corporate bond values are fluctuating the most in more than a year as Wall Street’s biggest banks opt against using their own money to absorb debt being sold by clients.
The 22 dealers that do business with the Fed reduced their net holdings of high-yield bonds by $1.7 billion in the two weeks ended Oct. 8 to a net $6.3 billion, Fed data show. They were joining the crowd in selling, with high-yield bond mutual funds receiving $7.4 billion of withdrawals since mid-September…” (Leveraged Money Spurs Selloff as Record Treasuries Trade, Bloomberg)
Here’s more from Bloomberg:
“High-yield investors are more worried that no one will bid on their bonds than they are about the risk of companies defaulting. At a time when the default rate for below investment-grade companies is holding at about half its historical average, junk-bond investors are increasingly concerned that they’ll be unable to sell when they want to…
“Clients now want to sell any bond they don’t want to hold for the long-term for fear that they will not be able to sell them later,” Bank of America Corp. analysts led by Michael Contopoulos wrote in a note today. The recent volatility “has been a wake-up call for many that dealer balance sheet constraints leads to faster price discovery and gappier price moves.”… (Lonely Bond Buyers Feel Deserted When Junk-Market Rout Heats Up, Bloomberg)
Investors are afraid that they won’t be able to get out when they want to?Precisely, and that fear is adding to market volatility.So what happens now?Well, it looks like things are going to get a whole lot crazier for a while, particularly if economic data is weak, and the Fed winds down QE on schedule. Then we could see a noticeable increase in the violent swings in daily trading. One thing to keep an eye on is yields on high-yield debt which have been gradually rising signaling that investors are less eager to provide cheap credit to marginal corporate borrowers. That’s going to make it more expensive to finance stock buybacks which means that the main driver of the stock market is going to begin to stall. When buybacks drop off, the markets will drift sideways leading to a selloff in the bond market that could spark a race for the exits. Here’s how Jeff Cox sums it up over at CNBC:
“Picture this: The bond market gets spooked by a sudden interest rate scare, sending a throng of buyers streaming toward the exits, only to find a dearth of buyers on the other side. As a result, liquidity evaporates, yields soar, and the U.S. finds itself smack in the middle of another debt crisis no one saw coming…
We saw the imbalance this summer, when global unrest caused sudden outflows from high-yield corporates, and last spring, when a swift, but not unprecedented, move in rates caused a negative knee-jerk reaction in credit spreads. As one trader put it: “The Taper Tantrum was the 30-second preview to a full feature film that might yet play out.” (This is the ‘doomsday’ bond market scenario, Jeff Cox, CNBC)
We’ve already had three dress rehearsals for Cox’s “doomsday scenario” since last summer, (the most recent of which took place last Wednesday when the Dow dropped 460 pts before rebounding.) so there’s no doubt that there’s trouble ahead. Once stocks start to fall, the bond bubble will burst igniting a broader selloff and a swift plunge in prices. That will leave the balance sheets of many corporations and financial institutions deep in the red precipitating a second major financial crisis in less than 7 years.Sound plausible?
I think so. And the problems can all be traced back to the easy money policies of the Central Bank; our friend, the Fed.
By Mike Whitney
Email: fergiewhitney@msn.com
Mike Whitney lives in Washington state. He is a contributor to Hopeless: Barack Obama and the Politics of Illusion (AK Press). Hopeless is also available in a Kindle edition. He can be reached at fergiewhitney@msn.com.
© 2014 Copyright Mike Whitney - All Rights Reserved Disclaimer: The above is a matter of opinion provided for general information purposes only and is not intended as investment advice. Information and analysis above are derived from sources and utilising methods believed to be reliable, but we cannot accept responsibility for any losses you may incur as a result of this analysis. Individuals should consult with their personal financial advisors.
Mike Whitney Archive |
© 2005-2022 http://www.MarketOracle.co.uk - The Market Oracle is a FREE Daily Financial Markets Analysis & Forecasting online publication.


