


Crude Oil Price Hitting Bottom
Commodities / Crude Oil Oct 22, 2014 - 09:19 PM GMTBy: Submissions

 Bob Loukas writes: In the past, we’ve discussed at length the structural problems facing Crude. So the pressure the energy markets are under, both from the demand and supply sides, should come as no surprise. This double whammy to the Crude market is not likely to be resolved overnight; demand-supply issues require time to work through a market.
Through hydraulic fracking and a massive influx of investment capital, the US has again become a major oil producer. But it’s the speed with which new supply from the US has come on line that has taken the market by surprise and rocked prices.
The 4 million plus barrels of extra oil that the US is suddenly producing is causing a problem for exporters like Saudi Arabia, who now need to find new markets for their oil. Most of the world’s oil is not sold in futures contracts for delivery one to three months out. Rather oil contracts are long term in nature, made over 1 to 3 year periods. And the competition for existing oil markets has been fierce, forcing suppliers to drastically cut their prices relative to spot.
As the price of oil begins to fall, oil producing nations, most of whom are ill-equipped to handle sub-$80 pricing, will likely try to offset the revenue lost through lower prices by raising their production. Saudi Arabia, the only nation capable of meaningfully cutting production, has stated that it will likely increase production to maintain its revenue levels. The other nations capable of possibly cutting production are Iraq, Iran and Venezuela, but all have economic issues that make any cut (without general consensus) very unlikely.
This should only perpetuate the glut of supply into 2015, setting the scene for much further declines in price as the markets are faced with continuing demand problems. If the European recession turns into a continent-wide event, its impacts on the world economy and, by extension, the demand for oil will put Crude prices under even more severe pressure.
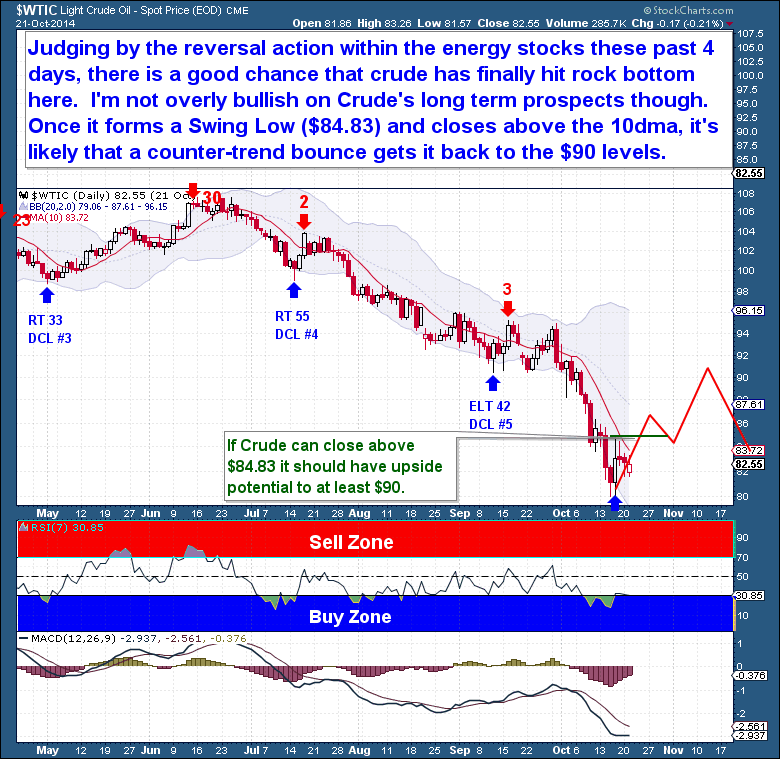
Judging by the Daily chart reversal in the energy stocks in the past 4 days, there is a good chance that Crude has finally hit (an intermediate time-frame) bottom. As outlined earlier, I’m not bullish on Crude’s longer term prospects, but the current sell-off has been severe, and is likely over for now. Given the uncertainty in the Crude markets, we need to see a close above the 10dma and Crude to form a Swing Low ($84.93). Once that occurs, it’s likely that a counter-trend bounce will move price back to at least the $90 level.
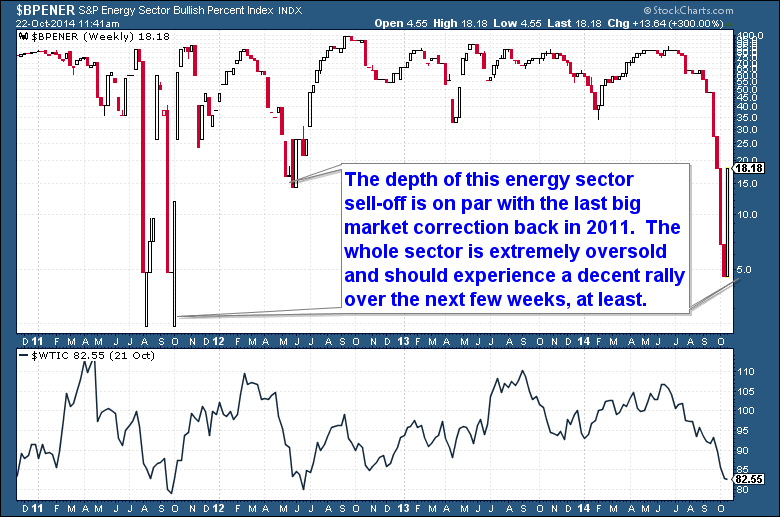
This sell-off has been extreme and much deeper than a standard ICL. The depth of the energy sector sell-off is on par with the last, big general market correction in 2011. The entire sector is now extremely oversold and should experience a decent rally during the next few weeks. But as in 2011, we don’t know is whether the current move down is just the beginning of a deeper decline.
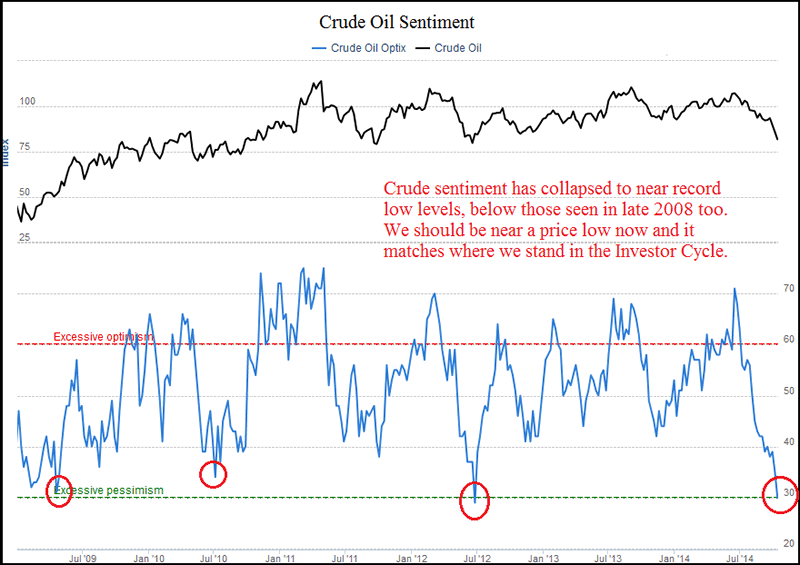
Crude’s weakness isn’t surprising – sentiment has collapsed to near record low levels, below even those from late 2008. Based on the overdue nature of Crude’s Investor Cycle Low, extremely low sentiment readings are suggesting that, at the very least, a new Investor Cycle (this Cycle averages 20-24 weeks) rally is about to begin. In the past, at similar sentiment levels, a sell-off comparable to what we’ve seen would have marked the low for the Yearly Cycle. So as with the equity markets, Crude is seeing lows deep enough to spawn a multi-month rally. But we also have evidence that suggests that a structural decline is now in progress.
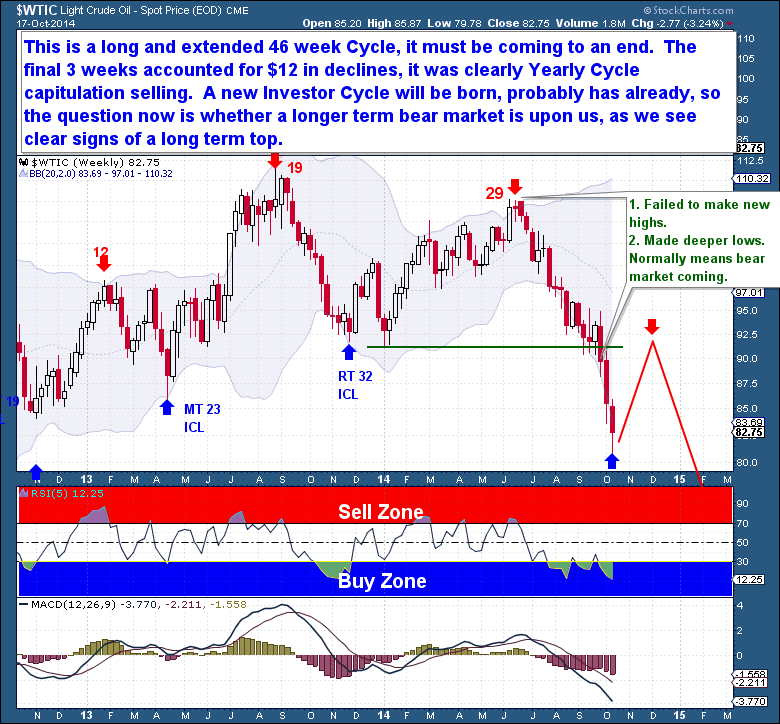
It’s clear that an extended 46 week Cycle is (or has already) coming to an end. The final 3 weeks yielded $12 in declines, clearly Yearly Cycle capitulation selling. If it hasn’t happened already, a new Investor Cycle will soon launch, so we’re faced with two questions: just how far the current Investor Cycle will rally, and whether a longer term bear market has arrived.
The presence of a new series of lower tops and lower lows on the Investor Cycle chart is suggesting that 2015 is likely to be a very challenging period for the energy markets. Like all assets, energy moves through Cycles of varying time-frames. I believe that the record investment of the past 5 years has resulted in too much production, which will lead to a period of business consolidation and bankruptcy.
The Financial Tap publishes two member reports per week, a weekly premium report and a midweek market update report. The reports cover the movements and trading opportunities of the Gold, S&P, Oil, $USD, and US Bond Cycles. Along with these reports, members enjoy access to two different portfolios and trade alerts. Both portfolios trade on varying timeframes (from days, weeks, to months), there is a portfolio to suit all member preferences.
You’re just 1 minute away from profitable trades! please visit http://thefinancialtap.com/landing/try#
By Bob Loukas
© 2014 Copyright Bob Loukas - All Rights Reserved
Disclaimer: The above is a matter of opinion provided for general information purposes only and is not intended as investment advice. Information and analysis above are derived from sources and utilising methods believed to be reliable, but we cannot accept responsibility for any losses you may incur as a result of this analysis. Individuals should consult with their personal financial advisors.
© 2005-2022 http://www.MarketOracle.co.uk - The Market Oracle is a FREE Daily Financial Markets Analysis & Forecasting online publication.