


Reasons the Bernanke-Yellen Asset-Price Inflation May Be Nearing Its End
Economics / Inflation Oct 19, 2014 - 04:17 PM GMTBy: Joseph_T_Salerno

 There are strong indications that the remarkable run up of asset prices in the last few years is beginning to run out of steam and may be on the verge of collapse. We will leave aside the question of whether the asset inflation is symptomatic of a garden-variety inflationary boom or is a more virulent bubble phenomenon in which prices are rising today simply because buyers anticipate that they will rise tomorrow.
The Evidence
1. The dizzying climb of London real estate prices since the financial crisis, noted in a recent post by Dave Howden, may be fizzling out. Survey data from real-estate agents indicate London housing prices in September fell 0.1 percent from August, their first decline since November 2012. Meanwhile, an index of U.K. housing prices declined for the first time in 17 months. In explaining the "pronounced slowdown" in the London real estate market, the research director of Hometrack Ltd. commented, “Buyer uncertainty is growing in the face of a possible interest-rate rise, a general election on the horizon and recent warnings of a house-price bubble,” which is playing out "against a backdrop of tougher mortgage affordability checks and limits on high loan-to-income lending."
2. Just released data from the Dow Jones S&P/Case Schiller Composite Home Price Indices through July 2014 shows a marked deceleration of U.S. housing prices. 17 of the 20 cities included in the 20-City Composite Index experienced lower price increases in July than in the previous month. Both the 10- and 20-City Index recorded a 6.7 percent year-over-year rate of increase, down sharply from the post-crisis peak of almost 14 percent less than a year ago.
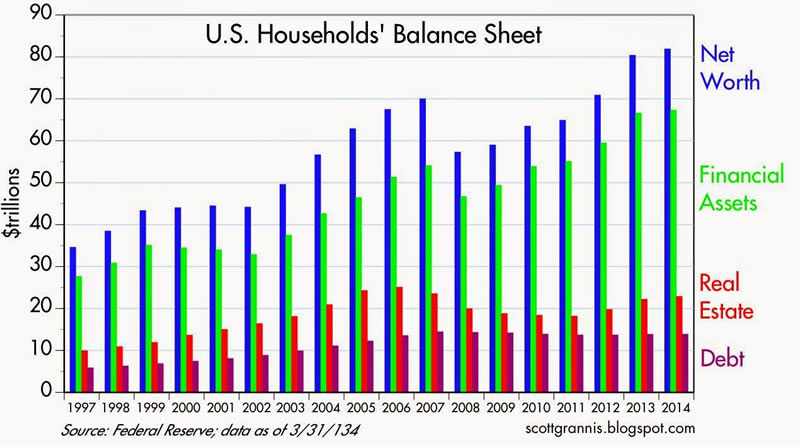
3. More ominously, U.S. Total Household Net Worth (HNW), as recently reported by the Fed for the second quarter of 2014, reached a record high of $81.5 trillion, over $10 trillion higher than the level at the peak of the asset bubble in 2007. Furthermore, the 2014 figure was $20 trillion higher than the level of the post-crisis — and pre-QE — year of 2008, when asset prices and the real structure of production were just beginning to adjust to the massive capital consumption and malinvestment wreaked by the Great Asset Inflation of 1995-2005. The increase in household wealth has been driven mainly by the increase in prices of financial assets which was generated by the Fed's zero interest rate policy and its force feeding of additional bank reserves into the financial system via its quantitative easing programs. (See chart below). These policies falsify profit and wealth calculations and give rise to unsustainable investments and overconsumption. Once interest rates begin to adjust to their natural levels, however, asset prices are revealed to be grossly inflated and collapse. The asset inflation may be reversed even without an increase of interest rates, if people lose confidence in the narratives fabricated and propagated by government policymakers, economists, and the financial commentators to promote the continuation of the inflation in asset markets. Furthermore it is risible to believe that real wealth in the US in terms of the factories and other capital goods to which financial assets are merely ownership claims, has increased by over one-third since 2008, especially in light of the additional malinvestment and overconsumption caused by monetary and fiscal policy “stimulus” since then.
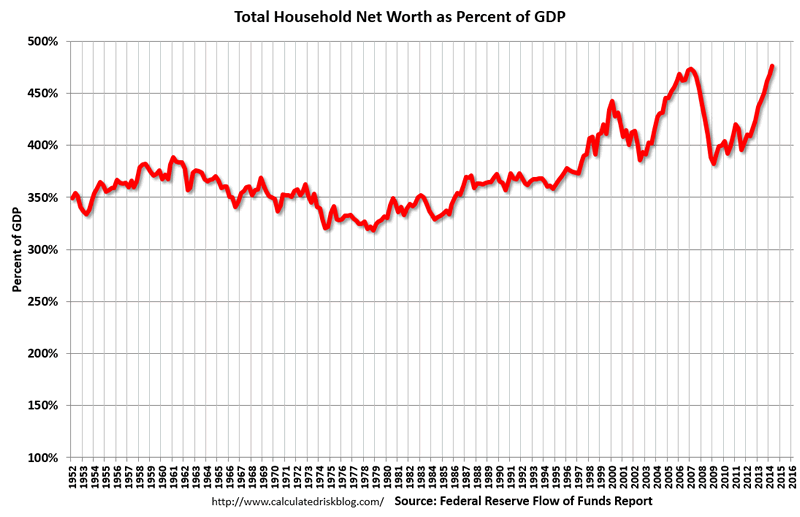
4. If we look at HNW in historical perspective, we note that, in the chart below, the HNW/GDP (or wealth to income) ratio is now at an all-time high. From 1952 to the mid-1990s this ratio averaged a little more than 350 percent and never went above 400 percent until 1998 as the dot-com bubble was blowing up. It peaked at nearly 450 percent before the bubble collapsed causing the ratio to plummet to slightly below 400 percent, indicating the beginning of the purging of the illusory capital gains created during the asset inflation.
But just as the adjustment was beginning to take hold in 2002, the Greenspan Fed played the deflationphobia card, driving interest rates to postwar lows and pumping up the money supply (MZM) by $2 trillion from beginning of 2001 to the end of2005. During this second phase of the Great Asset Inflation, the HNW/GDP ratio again reached a new high before plunging below 400 percent during the financial crisis. And, tragically, the nascent readjustment of financial markets to the underlying reality of the economy’s shattered and shrunken production structure was yet again aborted by government intervention in the form of the heterodox monetary policies of Bernankeism combined with the outsized deficits of the Obama administration. These policies succeeded in driving the HNW/GDP ratio to yet another new high, but without having the expected stimulatory effect on consumption and investment spending.
Conclusion
In sum, I do not expect that the ratio will rise much above 500 percent — Americans have just not saved enough since 1995 to have increased their real wealth from 3.5 times to 5 times their annual income. Nor is there much reason to expect a plateau anywhere near the current level. Once interest rates begin to rise — and rise they must, whether as a result of Fed policy or not — the end of the asset price inflation will be at hand. The result will be another financial crisis and accompanying recession. The Fed and the Administration will no doubt attempt to bail and stimulate their way out but given the still dangerously enervated state of the financial system and the real economy, it will be like dosing a horse that has already been overdosed to death. Thus my forecast for the U.S. economy one year to two years out echoes that of Clubber Lang, the villain in the movie Rocky III. When questioned about his forecast for the forthcoming fight against Rocky, Lang replied, “Pain.”
Joseph Salerno is academic vice president of the Mises Institute, professor of economics at Pace University, and editor of the Quarterly Journal of Austrian Economics. He has been interviewed in the Austrian Economics Newsletter and on Mises.org. Send him mail. See Joseph T. Salerno's article archives. Comment on the blog.
© 2014 Copyright Joseph Salerno - All Rights Reserved Disclaimer: The above is a matter of opinion provided for general information purposes only and is not intended as investment advice. Information and analysis above are derived from sources and utilising methods believed to be reliable, but we cannot accept responsibility for any losses you may incur as a result of this analysis. Individuals should consult with their personal financial advisors.
© 2005-2022 http://www.MarketOracle.co.uk - The Market Oracle is a FREE Daily Financial Markets Analysis & Forecasting online publication.