Stock Market Pullback Underway, Euro downside, Commodities
Stock-Markets / Financial Markets 2014 Oct 17, 2014 - 09:29 AM GMTBy: Puru_Saxena
 BIG PICTURE – The first round of QE began in March 2009 and after 5½ years, the Federal Reserve’s bond buying program is coming to an end. Since the QE program boosted confidence, combated deflationary forces and sparked an epic bull market on Wall Street; it is hardly surprising that its end has brought about some turbulence in the stock market.
There can be no denying the fact that over the past few years, the QE program significantly assisted the stock market by tackling the deflationary forces within the economy. You will recall that when QE1 and QE2 were ending, the stock market abruptly reversed course and the major indices started to face intense selling pressure. Thereafter, when the Federal Reserve unleashed its next bout of bond purchases, buyers returned in earnest and piled into common stocks.
Today, the QE initiative has run its course and the big question is whether the US economy is strong enough to stand on its own feet; or if the withdrawal of the punch bowl will bring about deflation?
At this stage, nobody can guarantee how this will play out; however, we suspect that the US economy will continue to muddle through and avoid an outright recession. Although there may be some near-term weakness in business activity, the economy is likely to continue its expansion.
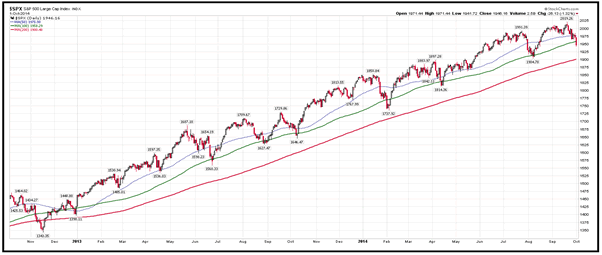
Turning to the stock market, we suspect that although a mean reversion to the 200-day moving average cannot be ruled out (Figure 1), Wall Street will not enter a prolonged bear-market for the following reasons:
(i) The Fed Funds Rate is at a historic low and the yield curve remains steep
(ii) For the foreseeable future, the Federal Reserve will maintain an accommodative monetary policy
(iii) Last but not least, the European Central Bank will soon unleash its own QE program; which will effectively pass on the baton to Mr. Draghi & Co.
Figure 1: S&P 500 Index - pullback is underway
Source: www.stockcharts.com
It is interesting to note that all year; the European Central Bank faced growing pressure from various governments, the mainstream academics and the International Monetary Fund to embark on a large scale government bond buying program. And all year, the European Central Bank resisted, arguing repeatedly that quantitative easing would yield little benefit in the Eurozone’s structurally challenged economy. Furthermore, Mr. Draghi also warned of the political and moral hazard that would arise as a result of exposing the European Central Bank’s balance-sheet directly to sovereign credit risk.
Yet last month, Mr. Draghi threw those concerns aside, pushing through a decision by the bank's governing council to cut interest rates and to embark on a program of large-scale bond purchases.
For now, although the European Central Bank will buy only asset-backed securities and covered bonds, the market may soon realise that a taboo has been broken. Put simply, Mr. Draghi's objective of restoring the European Central Bank’s balance sheet to its size as of early 2012 will equate to a possible US$1.26 trillion expansion and show that the central bank has shifted its focus to money-creation.
When the European Central Bank unleashes its QE program, the stock markets of the developed world will resume their northbound journey and the single currency will accelerate its slide.
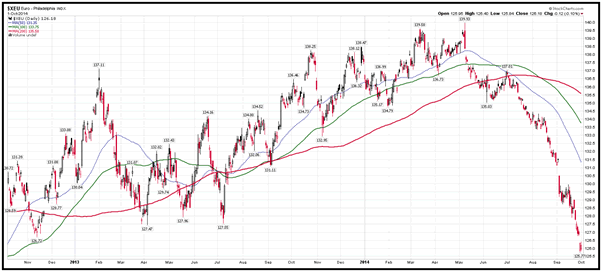
If you review Figure 2, you will observe that the Euro topped out in spring and since then, it has depreciated significantly against the US Dollar. In our opinion, when Mr. Draghi announces QE, the Euro will decline further and it may soon trade at a multi-year low.
Figure 2: Euro – more downside ahead?
Source: www.stockcharts.com
Similar to the US, we do not think that Mr. Draghi’s QE program will bring about an economic boom in the Eurozone. Nonetheless, we suspect that it will restore confidence, thwart deflationary forces and revive interest in the stock market.
If our assessment is correct, European Central Bank’s ‘stimulus’ will end the ongoing pullback in the stock market and it will set the stage for a multi-month rally. Furthermore, we suspect that bond purchases within the Eurozone will primarily benefit the stock markets of the developed world i.e. Europe, Japan and the US.
Remember, since April 2011, the stock markets of the developed world have outperformed the emerging nations by a wide margin and this trend will probably continue for the next 2-3 years. Accordingly, we have over-weighted our managed portfolios to Europe, Japan the US.
As far as sector analysis is concerned, airlines, asset managers, banks, biotechnology, broker dealers, defence, healthcare, insurance, semiconductors, railways and travel related stocks are showing strength. Conversely, agriculture, consumer staples, energy, materials, industrials and precious metals stocks remain weak and these should be avoided for now.
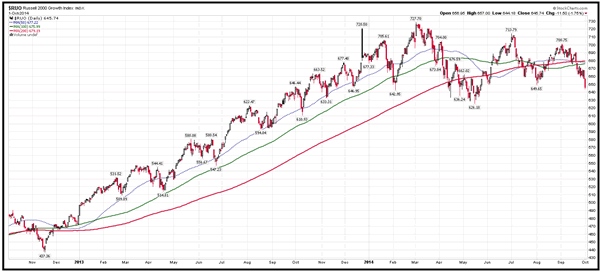
Although the widely followed major indices such as the Dow Jones and the S&P500 Index are holding up relatively well, some cracks have appeared in the market’s internals and these are worth monitoring. For instance, only 43% of the NYSE stocks are currently trading above the 200-day moving average. Furthermore, the small-cap counters as well as the growth stocks are struggling and the Russell 2000 Growth Index has now slipped below the key moving averages (Figure 3).
Figure 3: Russell 2000 Growth Index
Source: www.stockcharts.com
Elsewhere, the number of 52-week lows on the NYSE has now surpassed the number of 52-week highs on the NYSE and even the high yield bond ETF is trading beneath the 200-day moving average. Last but not least, the Volatility Index (VIX) is rising and this is another bearish omen for the market’s near-term outlook.
Over in the international markets, it is noteworthy that our preferred nations (India and Japan) are doing well and it appears as though additional gains are likely over the following months.
As far as India is concerned, much is expected from the new Prime Minister – Mr. Modi and if he delivers, the Bombay SENSEX will probably embark on an impressive rally. Consequently, we are maintaining our modest position in Indian equities.
Over in Japan, it appears as though the lengthy consolidation phase in its stock market is now complete and a new advance is underway. Currently, the Tokyo NIKKEI Average is taking a breather beneath last spring’s high but we suspect it should soon surpass that level. Make no mistake, the rally in Japanese stocks is primarily due to the weakening Yen and on that front, it is notable that after a lengthy consolidation, the currency has resumed its downtrend. Given our optimistic outlook, we have allocated some capital to Japanese stocks.
In summary, although the world’s stock markets are currently undergoing a pullback; we believe that this weakness will not morph into a prolonged bear market. After all, short-term interest rates are at historic lows, the majority of central banks remain accommodative and the European Central Bank is about to embark on its own QE initiative. Under these circumstances, we believe that the ongoing pullback will give way to a multi-month advance which will probably continue until spring. Accordingly, we are staying fully invested in our preferred investment themes.
COMMODITIES – The world’s reserve currency is strengthening; consequently, commodities (which are denominated in US Dollars) are automatically depreciating in value. Furthermore, the weak aggregate demand for commodities is not helping their cause either.
Due to these two factors, commodities remain trapped in a primary downtrend and it appears as though the weakness is likely to persist for the foreseeable future.
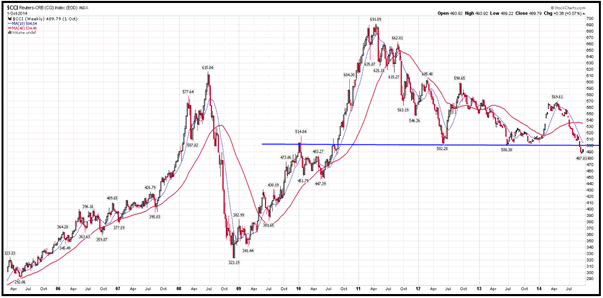
If you review Figure 4, you will observe that the Reuters-CRB Index (CCI) topped out in April 2011 and since then, the prices of natural resources have drifted lower. Furthermore, whereas in 2012 and 2013, the CCI Index found support around the 500 level (blue line on the chart), it has recently breached that key support level. By doing so, the CCI has reasserted its downtrend and opened up the possibility of a vicious decline.
Figure 4: Reuters-CRB Index (weekly chart)
Source: www.stockcharts.com
At this stage, nobody can guarantee how this will play out, but if the US Dollar appreciates sharply, commodities could experience a waterfall decline. Accordingly, we currently have no exposure to the physical commodities or the related stocks.
Although we do not possess a crystal ball, we believe that the primary downtrend in commodities will continue for at another 3-4 years. In fact, for the bear market to end, aggregate demand for ‘things’ will need to rise and that is not likely to happen in the near-term.
Remember, when it comes to commodities, China is the critical factor since the world’s most populous nation remains the largest consumer of natural resources. Unfortunately, China is currently dealing with its own problems, not least of which is the grossly overinflated property market.
Whether you like it or not, China’s real-estate sector is extremely overstretched and the value of its residential property stock now exceeds 400% of GDP! To put this in some perspective, it is worth noting that at the height of the Japanese real-estate boom in 1989-1990, its residential property stock also topped out at around 400% of GDP!
Apart from these two instances, never before in history has property become so expensive relative to the size of an economy; and we all know how the Japanese party ended. So, unless ‘this time is different’, you can be pretty sure that China’s property bubble will also pop and when it does, the shockwaves will be felt throughout the commodities universe.
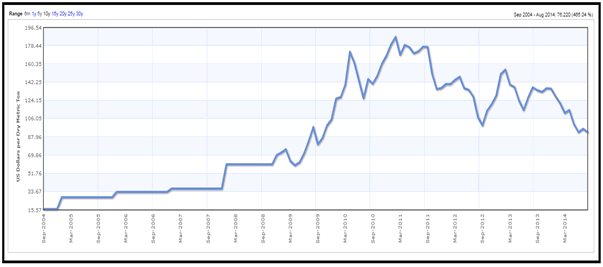
Even though China’s property boom is still intact, it is noteworthy that the prices of most base metals have declined significantly and the price of iron ore is currently trading at a 5-year low (Figure 5). In our view, these markets are discounting the looming troubles in China’s construction sector and when the inevitable bust arrives, things could get pretty ugly!
Figure 5: Iron Ore price – US$ per dry metric ton
Source: www.indexmundi.com
Elsewhere, the price of copper is also struggling and it is barely holding above the US$3 per pound level. If you review copper’s weekly chart, you will note that the metal has carved out a series of lower highs and this is typical bear market price action. From our perspective, the price of copper is extremely vulnerable and a decisive close beneath US$3 per pound may trigger a sharp decline.
In the agriculture complex, with the exception of coffee, prices are heading lower and this is a terrible time to be a farmer! Once again, the strengthening US Dollar is suppressing food prices, which is good for the consumer but unfavourable for the agricultural industry.
Last but not least, the price of energy is also coming under pressure and sellers are firmly in control of this market. Turning to specifics, it is notable that the price of crude has declined to a 52-week low and it is currently trading beneath the key moving averages. Elsewhere, the price of natural gas has also sliced through the key moving averages and the price of uranium is at a multi-year low.
Given the fact that the prices of various commodities remain in a primary downtrend, the related stocks are also struggling and this is not the time to be exposed to these securities.
Although the energy stocks performed well up until the summer months, the Oil Index (XOI) has broken down badly and it is now trading below the 200-day moving average. Moreover, the oil services and pipeline stocks have now also joined the downtrend, so our readers should consider liquidating their positions in this sector.
In summary, commodities are passing through a lean patch and the primary downtrend is likely to persist for several years. Therefore, we currently have no positions in the physical commodities or the related stocks.
Puru Saxena publishes Money Matters, a monthly economic report, which highlights extraordinary investment opportunities in all major markets. In addition to the monthly report, subscribers also receive “Weekly Updates” covering the recent market action. Money Matters is available by subscription from www.purusaxena.com.
Puru Saxena
Website – www.purusaxena.com
Puru Saxena is the founder of Puru Saxena Wealth Management, his Hong Kong based firm which manages investment portfolios for individuals and corporate clients. He is a highly showcased investment manager and a regular guest on CNN, BBC World, CNBC, Bloomberg, NDTV and various radio programs.
Copyright © 2005-2014 Puru Saxena Limited. All rights reserved.
Disclaimer: The above is a matter of opinion provided for general information purposes only and is not intended as investment advice. Information and analysis above are derived from sources and utilising methods believed to be reliable, but we cannot accept responsibility for any losses you may incur as a result of this analysis. Individuals should consult with their personal financial advisors.© 2005-2022 http://www.MarketOracle.co.uk - The Market Oracle is a FREE Daily Financial Markets Analysis & Forecasting online publication.


