Gold Seasonal Trend Analysis Points to Bargain Hunting Prices Ahead
Commodities / Gold & Silver May 19, 2008 - 02:22 PM GMT

 One of the most intriguing patterns in the current bull market in gold has to do with the annual buying opportunity which crops up in the depths of the summer doldrums.
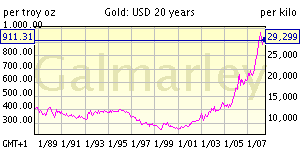
As depicted in the graph below, the end of a 20-yr bear market in gold was marked in 1999, and this new bull market was birthed in 2001.
 20 Year Gold Price Chart;
Secular Bear Becomes Secular Bull
  In focusing especially upon the particular trends revealed during each of these past seven bullish years, the cyclical buying opportunity in the traditionally quiet summer months is undeniable. Despite straddling the very middle of the year, pricing patterns in June and July have, with near perfect consistency, allowed investors the very latest-possible opportunity each year to buy gold at levels still below the forthcoming average annual price for that year (see annual graphs at right).
 In three of the past seven years, seasonal lows were accessible as early as May , typically following a pre-doldrum price surge in the earlier months of the year (see graphs for 2003, 2004, 2005). Only in the years where the larger gains were later in the spring (2001, 2006), were average June and July prices actually lower than those of May. That said, since this year's significant price gains occurred in the early months of February and March, one might reasonably suspect that the summer doldrums could arrive a bit earlier, as they have in previous years matching this early pattern.
Several economic factors support the possibility that the price advantages of the summer doldrums may also be shorter lived than in years past. Recently, economic heavyweights like Hank Paulson (Treasury Secretary) and Jamie Dimon (JPMorganChase CEO) have come forward to announce that the "worst is over" in the ongoing credit crisis. This rhetoric seems a little premature, however, as more large write-downs were announced this past week by AIG, HSBC, France's largest retail bank, Credit Agricole, and Germany's Commerzbank. UBS cut an additional 5500 jobs last week to make up for a 10.9 billion dollar first quarter loss. All the while, a recovery in the U.S. housing market isn't expected until some time next year. This does not bode well for the banking sector, and weighs upon the growth potential of the U.S. economy.
Simultaneously, inflation has made its way back into everyday discussion as food and energy prices have continued to skyrocket. Alan Greenspan recently commented on the bigger picture: "We are clearly receding with economic growth at 0 percent. It is too soon to call an end to the credit crisis stemming from the collapse of the subprime-mortgage market. The economy is returning to a more inflation-prone period. Import prices are rising, as are wages overseas, adding to pressures already caused by soaring cost of food, energy and commodities." To Greenspan's point, money supply growth is now estimated at 16%, though M3 statistics are no longer officially published. (Private firms such as Shadow Statistics at www.shadowstats.com now compile these figures.) And if we were to use the same guidelines used to derive inflation rates in 1980, the CPI today would be closer to 12%. Adding fuel to the flame is the aura of political uncertainty with this year's election and a continued unstable geopolitical situation in the Middle East. Gold's role as an inflation hedge and a safe haven is unparalleled, and will surely draw a great deal of interest as investors look to preserve and protect their assets against these threats.
Additionally, the gold market remains fundamentally strong. About a month ago, we published an article called " The Golden Gut Check ", which detailed the increasingly complex and potentially explosive disparity between physical supply and demand. An excerpt from the article: "When you account for the dedicated Chinese and Russian production, the projected central bank quota shortfall, the curtailment of sales from South Africa, and the potential for accelerated producer buy backs, a different picture emerges -- one not of copious supply but of shortages. The fundamentals lead us to the conclusion that there has been real substance to the gold rally of the past two years -- a rally which has taken the price 75% higher." "The Golden Gut Check" can be accessed at this URL -- http://www.usagold.com/amk/abcs-goldengutcheck.html
Furthermore, the the gold market activity over the past seven months bears a resemblance to the approximatley eight-month period in late 2005 to early 2006, a time during which a massive influx of investment capital helped push the price of gold to its then highest level in 25 years. Subsequently, those same funds exited the market in May and June of 2006, precipitating a significant correction. From there, we saw a protracted period of consolidation that set the base from which this latest major leg up was launched. Beginning in August of last year and culminating in mid-March, speculative interest combined with strong fundamentals to push gold to a new record high of $1030 ($1023.50 on the London fix). As was the case two years ago, though, large amounts of speculative capital that flooded into the market were eventually drained right back out in a profit-taking frenzy, causing a sizeable price correction. Ultimately, however, corrections and consolidative periods of this nature contribute to the long-term health of the up-trend.
In late 2006, we compiled a research essay to explain this volatile market activity. It was entitled " Has Gold Market Volatility Changed the Fundamental Reasons for Gold Ownership? " In this piece, we introduced a concept called the "rolling bubble theory", ascribing most of the volatility to fund activity -- their large-scale infusions and eventual retraction of speculative investment capital in short periods of time. This "flow" of funds resulted in the gold market appreciating more sharply than it might have otherwise, and subsequently retracing with comparable tenacity. The effective conclusion of this study, however, was that adding gold to your portfolio in the relative periods of calm that typically followed these speculative capital flows was a terrific investment strategy. In November 2006, we suggested that the post-pullback pricing range of $550-$600 might be the best buying opportunity of that year. As it turns out, you'd be hard pressed to find a disappointed gold owner who took on positions in those stable months. Will the same be said of $850 - $950 range, and the period of apparent consolidation and calm that we find ourselves in right now?
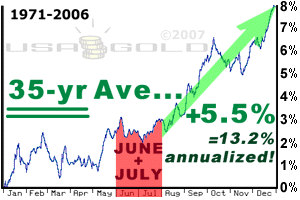
 Perhaps. But the larger point to take from this overview of seasonal price trends is that one need not necessarily attempt to further refine their weekly or daily timing of action beyond that which may obtained merely by blind action -- meaning, any random assortment of purchases made throughout May, June or July on average proves to be a fruitful maneuver by year-end. (And it just so happens that the latest round of speculative fund flow and resulting price action appears to be coinciding to nicely augment this seasonal opportunity for 2008.) To emphasize the point, in the recent 35 years, over two-thirds of the average annual gains have been registered between August and December , as demonstrated by the nearby 35-yr summary graph.
 While that graph demonstrates that the up-trend of gold's average seasonal performance transcends both bull and bear market eras collectively, a focus on the recent bull market reveals an even brighter picture. For the most-recent seven years , randomly made (i.e., average) gold purchases during these summer doldrum months of (sometimes May,) June and July, as demonstrated in the graphs above from 2001 through 2007 , have subsequently benefited from notable year-end seasonal strength. Price gains from August through December have averaged 12.9 percent -- representing an impressive 30.9 percent as an annualized rate of gain.
This is certainly good news for the bargain hunter, taking that old Wall Street adage, "to sell in May and go away," and turning it completely on its ear.
By Michael J. Kosares
Michael J. Kosares , founder and president
USAGOLD - Centennial Precious Metals, Denver
Michael Kosares has over 30 years experience in the gold business, and is the author of The ABCs of Gold Investing: How to Protect and Build Your Wealth with Gold , and numerous magazine and internet articles and essays. He is frequently interviewed in the financial press and is well-known for his on-going commentary on the gold market and its economic, political and financial underpinnings.
Disclaimer: Opinions expressed in commentary e do not constitute an offer to buy or sell, or the solicitation of an offer to buy or sell any precious metals product, nor should they be viewed in any way as investment advice or advice to buy, sell or hold. Centennial Precious Metals, Inc. recommends the purchase of physical precious metals for asset preservation purposes, not speculation. Utilization of these opinions for speculative purposes is neither suggested nor advised. Commentary is strictly for educational purposes, and as such USAGOLD - Centennial Precious Metals does not warrant or guarantee the accuracy, timeliness or completeness of the information found here.
Michael J. Kosares Archive |
© 2005-2022 http://www.MarketOracle.co.uk - The Market Oracle is a FREE Daily Financial Markets Analysis & Forecasting online publication.


