


Gold; a Simpleton’s View
Commodities / Gold and Silver 2014 Oct 08, 2014 - 04:45 PM GMTBy: Gary_Tanashian

First off, if you have an interest in the price of gold and have not already done so, I highly recommend you check out Steve Hochberg’s 2-part Elliott Wave video presentation on gold (disclosure: free sign up to Club EWI brings a small commission to yours truly ![]() ). With all his zigs, zags, waves and patterns he ends up at the same place I do with my simple version. I may use less cluttered methods, but I find this stuff very interesting.
). With all his zigs, zags, waves and patterns he ends up at the same place I do with my simple version. I may use less cluttered methods, but I find this stuff very interesting.
With markets at a key juncture, the US dollar over bought (but bullish), the precious metals, commodities and increasingly, global markets over sold but bearish and US stocks acting as if October 2014 could at least recall memories of October 2008, I want to try to weave all this together around the simplistic monthly chart of gold, which is the asset that would provide liquidity for asset market refugees if the macro really were to get very negative.
It is important to simplify folks. Gold is not going to go up because of Modi and Indian Wedding season. It is not going to go up on China demand and it is most assuredly not going to go up because the US stock market is going up, as if it were simply an asset class that got left out of the party. Commodities actually would have a better chance at that than gold.
Gold is going to go up (at least in relation to most assets) when confidence in policy making starts to wane… period. I am going to keep this simple monthly chart on radar going forward because it has long-since broken the Triangle and it is a gauge on the macro.
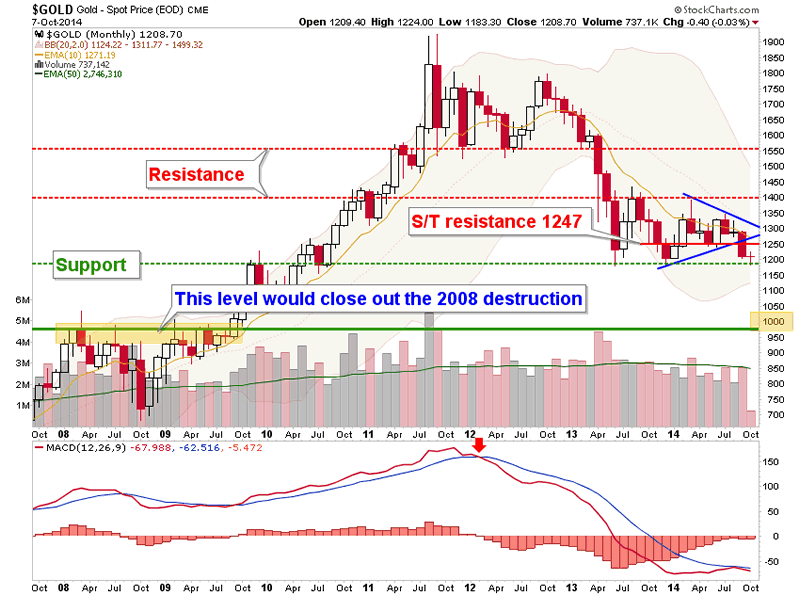
Shorter-term data points indicate that a bounce is very possible if it has not already begun. But the Triangle pattern and distance from support to resistance measure to 1000 and what I find more interesting than the raw chart is the idea of closing out the misery of 2008 in a final declaration that policy making has succeeded (in cleaning up the disaster created by previous policy making leading into 2008).
Markets are often poetic and they are even more often ruthless, as this one will probably be toward those caught revering or worse, taking for granted, the job Policy Central has done post-2008. When gold is ready to bottom, we would then likely start finding out the details of just how damaging the current clean-up of previous damaging policy has been.
What to Look For
If silver begins to lead gold and there is a bounce in the sector along with commodities it would be a counter-trend play. Read more into it than that at your own peril. Further, if you hear the usual suspects coming out with Indian Weddings, China demand or worse, the end of the world talk about the US stock market, be very careful (unless gold is above 1400 at such time, which is doubtful any time soon, and US stocks are completely broken down). If things get bullish near term please keep your tender gold bug heart steeled against the promoters who cannot wait to sound the call once again.
While we are managing what was a fully expected decline in US stocks this October, we should be aware that it feels just a little bit scripted. Ooohhh, it’s October! Ha ha ha… the corrective activity in the stock market could ultimately be a healthy thing to reset the over bullishness that made every stock jockey with a couple well-known symbols look smart.
Another possibility is that the stock market bull really is over (there are some beneath the surface indicators we follow that are bearish) and that gold has not finished leading the way down amidst a deflationary pull. So we should also manage each market on its own and in consideration of its individual role in the macro.
Going back to gold, its simple big picture chart is bearish until it either gets above the Triangle’s nose at 1300 and/or rises above 1400. The time seems about right for a counter trend bounce (watch 1247 as initial resistance) to embolden some in the gold “community”. But a renewed decline to 1000 would likely be a time to get very bullish because not only would a very relevant technical juncture be attained, but the poetic justice of closing out the 2008 economic and market disaster could represent a psychological critical mass where confidence in policy makers – tops out.
Subscribe to NFTRH Premium for your 25-35 page weekly report, interim updates (including Key ETF charts) and NFTRH+ chart/trade ideas!
By Gary Tanashian
© 2014 Copyright Gary Tanashian - All Rights Reserved
Disclaimer: The above is a matter of opinion provided for general information purposes only and is not intended as investment advice. Information and analysis above are derived from sources and utilising methods believed to be reliable, but we cannot accept responsibility for any losses you may incur as a result of this analysis. Individuals should consult with their personal financial advisors.
© 2005-2022 http://www.MarketOracle.co.uk - The Market Oracle is a FREE Daily Financial Markets Analysis & Forecasting online publication.