


GBP Still Trading Under Pressure: Can This Continue?
Currencies / Forex Trading Oct 06, 2014 - 03:26 PM GMTBy: Richard_Cox

 Dollar strength continues to dominate, so if there is any way to characterize the overall behavior in forex markets for the final portion of the summer, it would be done using the pronounced bullish moves that have been see against the Euro and Pound. Most of this positive activity in the greenback has been supported by risk aversion and geopolitical tensions (which were present in several major economic regions around the world). This sent the PowerShares DB US Dollar Index Bullish ETF (NYSE: UUP) to new highs, and this strength came at the expense of both the Euro and British Pound (GBP), which are both trading at some of their lowest levels of the year.
As a less liquid currency, the British Pound has fallen more than 1,000 points from highs above 1.70 to trade now just above 1.61 versus the US Dollar, according to recent reports from recent reports from ForexAbode. But the real question is whether or not these trends have become overdone and are likely to continue. If we continue to see mentions of military conflicts in the Russia/Ukraine region or in the Middle East, forex investors are likely to continue flocking to the safe haven USD as a means for market protection. This will be the main focus for GBP traders, as the recent news of the independence vote in Scotland has now faded mostly from the headlines in terms of its overall market impact. Here, we look at the latest technical developments in the forex majors.
__________________________________________
GBP/USD - British Pound vs. US Dollar
Critical Resistance: 1.6250
Critical Support: 1.6110
Trading Bias: Looking for Topside Reversal
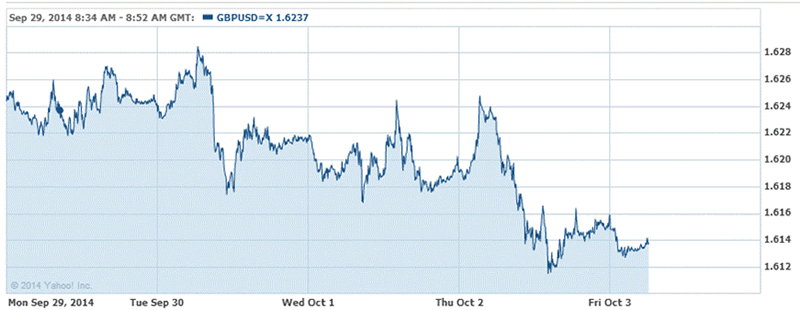
(Chart Source: CornerTrader)
GBP/USD Forex Strategy: Prices are highly oversold, so don’t go chasing short positions at current levels. If we see a break above 1.6160, it will take some pressure off the topside.
The British Pound GBP/USD has had a rough couple of trading weeks but prices are attempting to stabilize and we are in serious need of a corrective move back toward the longer term moving averages. If this were to occur, the first signal would be sent on a clear break of the 1.6160 mark as this would at least turn the short term bias to sideways. At this stage, the best case scenario for Pound bulls would be seen if active shorts start to cover their positions and take profits. If this were to occur, we could start to see momentum building in the other direction, especially if resistance at 1.6250 is finally overcome. The Daily RSI indicator is starting to flatten out near oversold territory, so there is limited scope here for short term declines.
_______________________________________
USD/JPY - US Dollar vs. Japanese Yen
Critical Resistance: 109
Critical Support: 108
Trading Bias: Wait for Dips
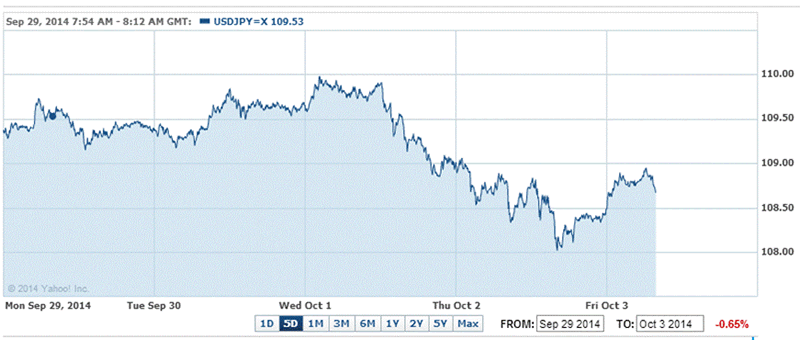
(Chart Source: CornerTrader)
USD/JPY Forex Strategy: Stay on the sidelines, until we see better price values. First major support can be found at 108, bulls can start to build long positions from there.
The USD/JPY has made a violently bullish move since the middle part of this year and this is significant because it essentially confirms the bullish bias that we have been calling for months. Prior to this we were dealing with very tight trading ranges so it will be a good idea for investors to stay on the sidelines and wait for some corrective downside retracement. The Daily RSI indicator is still rolling over from overbought territory, so this will be a good gauge for knowing when to buy if we start to see the reading drop below 50.
By Richard Cox
© 2014 Richard Cox - All Rights Reserved
Disclaimer: The above is a matter of opinion provided for general information purposes only and is not intended as investment advice. Information and analysis above are derived from sources and utilising methods believed to be reliable, but we cannot accept responsibility for any losses you may incur as a result of this analysis. Individuals should consult with their personal financial advisors.
© 2005-2022 http://www.MarketOracle.co.uk - The Market Oracle is a FREE Daily Financial Markets Analysis & Forecasting online publication.