Stock Market Dow Trend Forecast Summer 2014
News_Letter / Stock Markets 2014 Oct 04, 2014 - 07:32 AM GMTBy: NewsLetter
 The Market Oracle Newsletter
June 5th , 2014 Issue # 13 Vol. 8
Stock Market Dow Trend Forecast Summer 2014
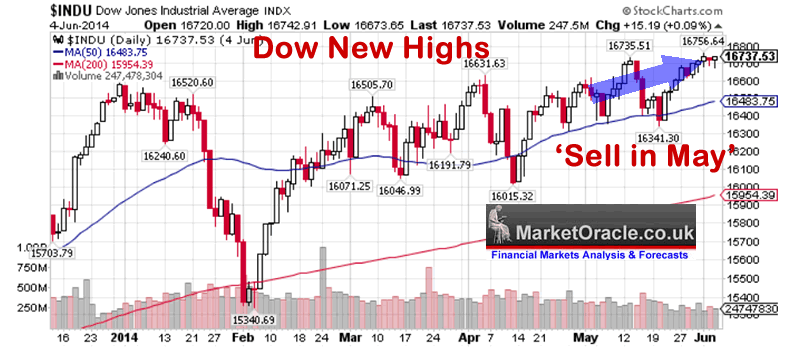
Dear Reader No 'Sell in May and Go Away' this year for Either Bulls or Bears Watching the disconnect between stock prices and what passes for stock market commentary since my last detailed look at the stock market of early Feb 2014 is akin to watching two parallel universes in motion that never meet! Where the stock market exists in one universe and the so called stock market analysts (who are really either sales men or journalists who think they are analysts) residing in another. Whilst stocks relentlessly grind higher the others relentlessly scream at the top of their lungs, the 'top is in' the 'top is definitely in this time' following every reaction off a high only to see the stock market once more pop to a new all time high a few weeks later. They MUST reside in separate universes, how else can they continue to reconcile such madness week in week out? It's literally witnessing a form of mass delusion. Off course it is all about human perception. Where the default human condition appears to be to always anticipate a termination of trend. I have my own take on the reason why - It's because most of what you read (95%) is clearly written by those that DO NOT TRADE or even INVEST ! For if they did they would have bankrupted themselves several times over by now, and so devolve to that which engenders the most sales interest i.e. TERMINATION of TRENDS, CRASHES, ACTION, Not a boring 5+ year old bull market laboriously grinding higher - That does NOT sell copy, encourage purchases. This should not come as any surprise because - Profitable investing is NOT easy! Perhaps only 1/3rd of investors will manage to grow their capital year on year, and even less will be able to beat inflation, maybe only 20% will actually manage to make a real terms gain investing. That's not what the sales pitches by snake oil salesmen will led you to believe with their fairy tale 99% profit sales pitches. The reason for this is because the sales pitches always focus on what is irrelevant in respect of successful investing, they do not have a clue - NOT A SINGLE CLUE of what is actually required in respect of profitable investing. And if investing is so difficult then imagine how much more difficult it is to be a successful trader! Forget 10%, the reality is more like 1%, so what are the other 99% of failed traders busy doing ? Yeah, you guessed it selling snake oil to the newbie's be it the giants such as CNBC or the tiny fly by nights with their black box systems when I KNOW for a fact SYSTEMS DO NOT WORK! You cannot succeed trading by using back fitted systems! In my experience the only way to succeed in trading is by reacting to price movements in real time, that and utilising money management as I cover at length in my last stock market ebook of March 2013 - Stocks Stealth Bull Market 2013 and Beyond (FREE DOWLOAD). Where the stock market to date is concerned, even before the month of May began the mantra of 'Sell in May and Go Away' had built up to a crescendo by the blogosfear that always sees a trend, any trend be it bull or bear as always IMMINENTLY TERMINATING, instead the stock market has climbed its way to a series of new all time highs the most recent of which was Monday's Dow close at 16,743 with yesterdays just 6 points shy of breaking to a another new high of 16,737 and the S&P's yesterday new high close of 1928.
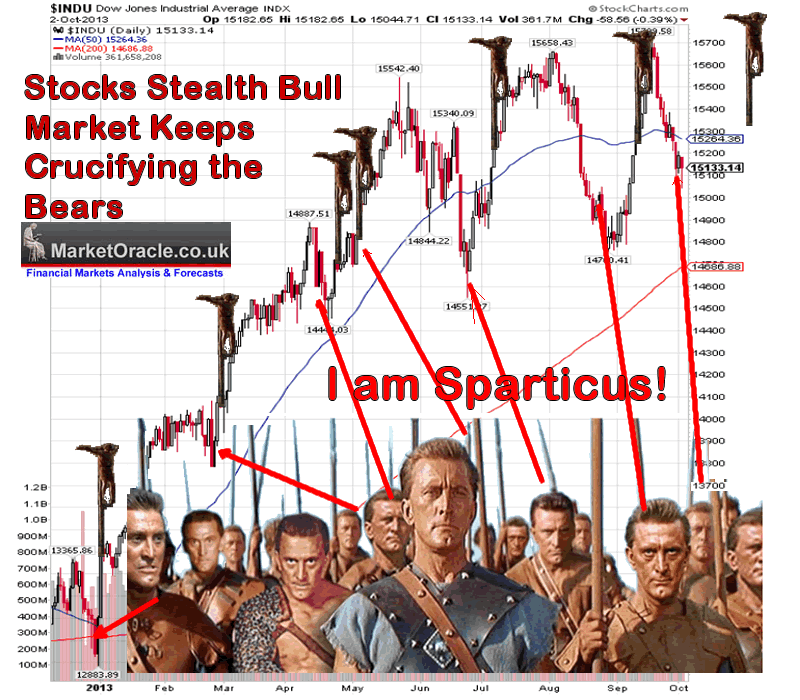
The series of new highs has continued to result in perma tripe that the stock market MUST fall as illustrated by the highly popular TheStreet take on a recent break to new highs. 30th May 2014 - What Happened to 'Sell In May and Go Away'? So, where do we go from here? The S&P 500 and the Nasdaq are both well into overbought territory. On a green open Monday both indexes will again be approaching extreme overbought conditions. This market is a trader's market and is not for the buy and hold crowd. Furthermore the author confesses to having SHORTED the rally on the way up! I totally understand the risk that is involved in this market as we continue higher. As a trader I do not have to participate in the buying spree. As a matter of fact I have been shorting specific positions during this ramp higher. Friday was a big payday as I covered those shorts when the market was red. Yeah, right, sure you made money shorting the RALLY on the way UP! As I have covered many times over the years, it is not of much value to explain why something has already happened because any news event could be used to explain a rise or a fall in market prices and usually the perma- fools (journalists) can be found explaining either a rise or fall in the stock market on the basis of the SAME data on differing days. This illustrates why most investors miss whole bull and bear markets, it is because they are paying attention to those that don't even trade! The smartly dressed idiots reading off autocue's written by journalists, managed by senior journalists none of whom have ever traded and if they had they FAILED because that's why they ended up where they are. Similarly, highly vocal snake oil sales men can be touting their worthless insights in the mainstream news media, spending hours arranging and traveling too and from TV studios across the world, usually culminating in commentary that can be construed towards ANY eventual outcome i.e. that the stock market could rally but then again the stock market could also fall, afterwards they focus only on the aspects that turned out to be right despite the fact that such commentary was completely in actionable at the time and to all intents and purposes worthless, just as a means towards promoting worthless services to the gullible masses. Whilst the delusional perma bears can only continue with their slave like mantra that the top is in and everyone should go short each time the Dow retreats a few points from its last rally high that I have repeatedly warned to IGNORE as they are literally setting themselves and anyone who listens to them to be crucified! 03 Oct 2013 - U.S. Government Shutdown Great for Stocks Bull Market, Bears Will be Crucified Again I keep being reminded of the movie SPARTICUS where the slaves are lined up at the end just like market commentators line up at the depths of market corrections to once more proclaim that they too are ALL Sparticus! Calling THE Top! However, we all know what happens at the end of the movie, as they all end up getting crucified, and we don't have to look far to see what happened following EACH end of the bull market final top call of just this year! Let alone a bull market that is now well into its fifth year.
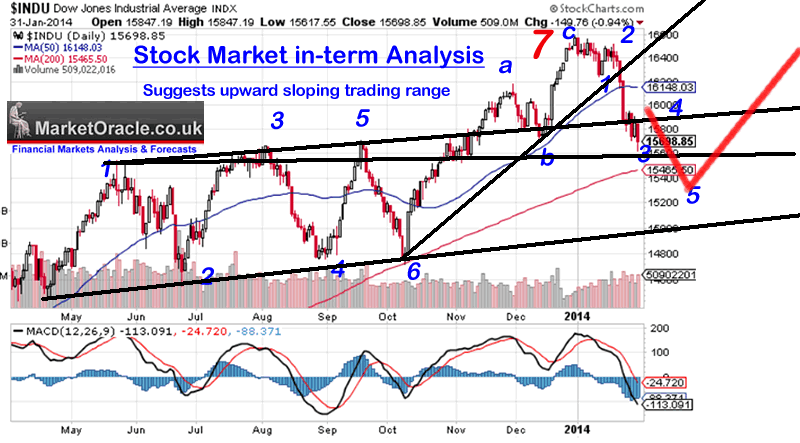
The bottom line is this the US government shutdown is GREAT NEWS! because for bull markets to persist and continue they NEED BAD NEWS every few months, THEY NEED MOST PEOPLE TO BE SKEPTICAL, TOO AFRAID TO INVEST! And so it continues to be the case for the DURATION OF THIS BULL MARKET, where over 90%, NINTEY PERCENT OF Market commentators have been WRONG and continue to be WRONG, Everyone who has just proclaimed its END IS WRONG and Will BE CRUCIFIED, just as they have been crucified at every market turn for the past FIVE YEARS ! YOU WANT TO LOVE MARKETS THAT ARE HATED! YOU WANT TO BE AFRAID OF MARKETS THAT ARE LOVED! UNDERSTAND THIS - THIS stocks stealth bull market is one of the GREATEST bull markets in HISTORY! Off course a real life crucifixion would mean the fools would would ceased and desisted in their demented ramblings, but that is one of the negatives of the passing of the Pagan Roman Empire. Instead the so called market commentators march on as if nothing happened despite spouting more garbage because clearly they NEVER put their own money on the line, which is the real secret for arriving at the most probable outcome. This is why virtually every time I write an article on the stocks bull market I get so many comments and reasons to explain why I this time I am wrong and it has ended. Instead I have to reiterate what I have voiced for the duration of the stocks stealth bull market in over 200 articles (Stealth Bull Market Follows Stocks Bear Market Bottom at Dow 6,470 ), my strategy has been very, very simple, no black box voodoo to sell garbage to the unsuspecting masses but simply this - " The Greater the deviation from the stock market high then the Greater the Buying Opportunity Presented". And, you can't get any simpler than that ! My strategy is simply to buy deviations from the highs, the mechanisms for market positions is money management, something that is rarely if ever mentioned because that is not what the punters want to hear they want to hear about the future, they don't want to hear about the actual mechanisms for making profits which is has its roots in two elements - a. Money management b. Real-Time For a further dose of stock market reality over rhetoric of the perma crash is always coming here is an timely excerpt from my article of last November in response to warnings of an imminent 40-55% CRASH now over 6 months on! 11 Nov 2013 - Stock Market Forecast 2014 Crash or Rally? Drone Wars and the Nuclear Apocalypse Stock Market Crash? Whilst the press is populated with doom commentary such as that of John P Hussman highly regurgitated recent article that warns of a 40-55% stock market crash! Can you believe that forecasting a 40-55% CRASH! When a crash is a panic event, that cannot be forecast ! ONLY TRADED! That says it ALL! John P. Hussman - In any event, I continue to believe that it is plausible to expect the S&P 500 to lose 40-55% of its value over the completion of the present cycle, and suspect that whatever further gains the market enjoys from this point will be surrendered in the first few complacent weeks following the market’s peak. That’s how it works. If all of this seems like hyperbole, please recall my similar concern at the 2007 peak (see Fair Value – 40% Off), and the negative 10-year return projections – even on best-case assumptions – that we correctly estimated for the S&P 500 in 2000. These numbers relate to the striking gap between present valuation levels and normal historical precedent, not to personal opinion. And here's what Hussman wrote about the stock market a year ago: Hussman: Bear Market Looms Despite Flirting With Record The stock market’s recent advance to almost record highs isn’t a sign of good things to come, says John Hussman, president of Hussman Investment Trust. “[T]he present is a terrible time to accept a significant amount of market risk,” he says in his weekly market commentary. While it’s impossible to predict where the market is headed over the next week or month, “there is strong precedent for extended market losses and bear markets following overvalued, overbought, over bullish, rising-yield syndromes,” Hussman says. And the year before: John Hussman Isn't Buying The Rebound “At present, the S&P 500 is again just 10 per cent below the high it set before the recent market downturn began,” he said. “In my view, the likelihood is very thin that the economy will avoid a recession, that Greece will avoid default, or that Europe will deal seamlessly with the financial strains of a banking system that is more than twice as leveraged..." His follow up article of over 6 months ago was titled A Textbook Pre-Crash Bubble. A log periodic pattern is essentially one where troughs occur at increasingly frequent and increasingly shallow intervals. As Sornette has demonstrated across numerous bubbles over history in a broad variety of asset classes, adjacent troughs (say T1, T2, T3, etc) are often related to the crash date (the “finite-time singularity” Tc) by a constant ratio: (Tc-T1)/(Tc-T2) = (Tc-T2)/(Tc-T3) and so forth, with the result that successive troughs come closer and closer in time until the final blowoff occurs. Frankly, I thought that this pattern was nearly exhausted in April or May of this year. But here we are. What’s important here is that the only way to extend that finite-time singularity is for the advance to become even more vertical and for periodic fluctuations to become even more closely spaced. That’s exactly what has happened, and the fidelity to the log-periodic pattern is almost creepy. At this point, the only way to extend the singularity beyond the present date is to envision a nearly vertical pre-crash blowoff. So Yes, John Hussman is a 'I am Sparticus', I call it perma-tripe. A closer look at his website explains why because what he is effectively SELLING is BEAR MARKET PROTECTION! (investment funds). So as I have pointed out many times over the years that almost 95% of what you read is either a SALES PITCH or a sales pitch that is being regurgitated by clueless journalists and the BLOGOSFEAR ! Sales pitches are the order of the day for instance Religions give their sales pitch that you must give up freewill in this life and follow doctrine to gain entrance AFTER you die to an afterlife. Science gives its sales pitches for hundreds of billions in academic funding, for instance that 95% of the Universe is DARK, invisible. When it is common sense that, that is utter nonsense for 95% of the Universe to be made of something that cannot be measured such as Dark Energy or Dark Matter so as to fit in with Einstein's theory of general relatively. It's obvious ! Einstein is WRONG! Einstein was wrong in terms of the way Gravity behaves across the Universe across its HISTORY. What Einstein's theory predicts is where the Universe is today and where it must have been at the beginning so as to arrive at our current destination. But the problem is, as is with the case for stock market trends, that trends are NOT SMOOTH LINES. Therefore neither is the history of gravity in the evolution of the universe. Gravity at the time of the big bang and Gravity today are NOT the same. If you subscribe to this then you no longer have a need for DARK energy and matter to explain how the Universe expanded from the big bang to its current state of acceleration. So the consensus view of dark energy and matter is wrong because in reality they do not exist, instead it is our understanding of gravity and its history which is wrong, or rather incomplete. This is what commonsense suggests..... more in a future article. Whilst my last in-depth look at the Dow at the then heights of an new imminent bear market about to begin mantra of early February 2014 concluded in the following trend expectation: 3rd Feb 2014 - Stocks Bull Market Over? Are the Bears About to Break...even? The current stock market correction looks set to attempt to revisit 15,000. How close it gets to 15,000 I can't tell, perhaps half way, just that the correction is not done to the downside. Following which the price chart implies that the Dow will enter an upwardly sloping trading range that would target a NEW all time high. However given the nature of trading ranges it is difficult to say how many swings it would take for such an outcome to occur, i.e. the last such trading range comprised 7 swings before breaking higher. This one could be quite brief and just comprise 2 swings as indicated by the chart, which could imply a New Dow high by early April, though that does not mean that the Dow would be able to hold the high as it could remain in the upward sloping range for some time which implies Sell in May and Go away as probable.
So to answer the question - Is the stocks bull market over ? NO ! No sign whatsoever that this (what people decades from now will look back on as being the greatest bull market in history) bull market is anywhere near being over! The subsequent price action closely matched my trend expectations as the Dow bottomed at around 15,250, and then began its volatile climb to set a new all time intra-day high on 4th of April 2014 at 16,631, just failing to break its closing high of 16,577 of 31st December 2013 by 5 points (16,573)that had remained pending until the 30th of April. STOCK MARKET ANALYSIS FOR SUMMER 2014 TREND DOW TREND OSCILATION - Current over oscillation of about 4%, against earlier under oscillation of 5.5% (See Feb article) is NOT abnormal. Oscillations can easily extend to 10% around the trend trajectory which currently extends to a range of 17,600 to 14,400. Clearly the Dow at 16,737 whilst mildly over bought has room to extend further higher whilst at the same time has plenty of room for a significant correction which on a normal oscillation of -5% implies 15,300 today and approx 16,000 2 months forward.
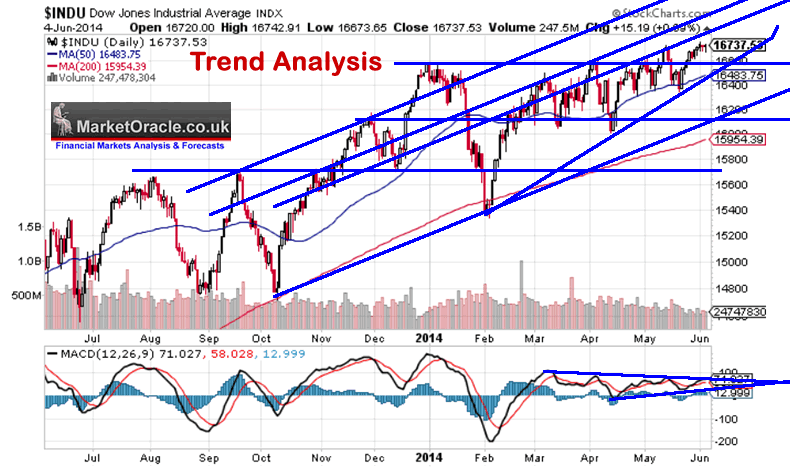
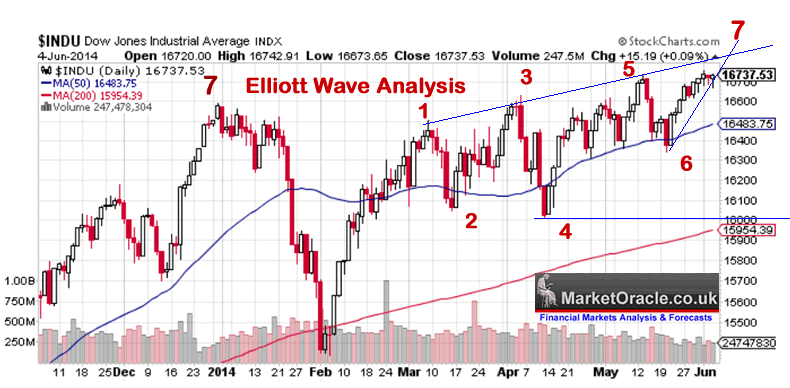
TREND ANALYSIS - The Dow's rally is clearly losing steam as the channels containing the rally highs are narrowing in which means whilst the Dow rally may continue it will likely to be weak, where a few weeks ago a 200 point jump could have been hopped in a couple of days, today another 200 points will be a pretty painful and slow process to achieve which means that the Dow may not even reach the long anticipated target of Dow 17,000 (See 11 Nov 2013 - Stock Market Forecast 2014 Crash or Rally? Drone Wars and the Nuclear Apocalypse) before turning lower. Whether the Dow makes it to 17k ahead of the next correction is literally a coin flip at this stage, at best a 45% probability. PRICE TARGETS - Clearly Dow 17,000 is the key upside target towards which the Dow is attempting to trend before correcting. On the downside there are a series of preceding highs all the way from 16,588 to 16,735 that the downtrend would first need to slice through. Further afield support comes in around 16,000 to 16,050 that would be the main target for any downtrend. Should 16k fail then expect a spike lower to around 15,700. Therefore the Dow currently has no resistance, and plenty of support which implies a volatile, perhaps weak downtrend. MACD - MACD is not particularly overbought so not signaling an imminent correction. The best pattern for a stock correction would have seen the MACD at a new six month high instead it implies it could either continue to trundle along or is set for a spike higher or just roll over into a weak correction which is what I am seeing as being the most probable outcome. ELLIOTT WAVES - Continuing with my unorthodox interpretation of EWT (see last Feb analysis) for a 7 wave structure rather than 5 implies that the Dow is now in its final 7th wave of the advance that began in late February. The minor wave structure suggests that the Dow has further to go to the upside time wise, perhaps a week or so, but the price action is running out of steam which probably means that the trend higher will be weak and not comparable to that of the last few weeks.
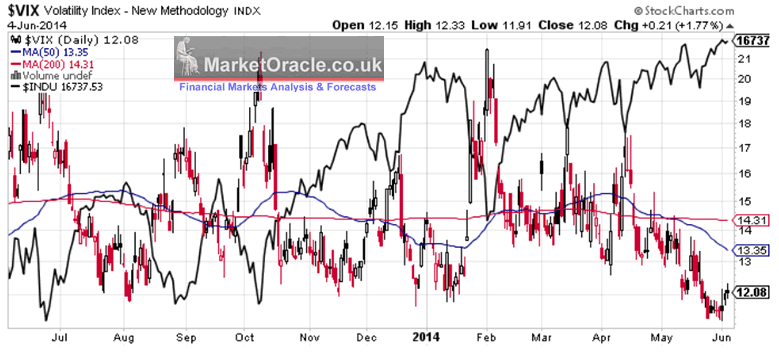
Following the 7th Wave peak the Dow is expected to enter into a significant correction that targets the Wave 4 low around 16k, and could spike a little lower to just under 16k. VOLATILITY - VIX - The higher the stock market has snaked the lower market volatility has trended that has claimed many bear scalps as the oft reported on imminent stock market plunge has failed to materialise for several months.
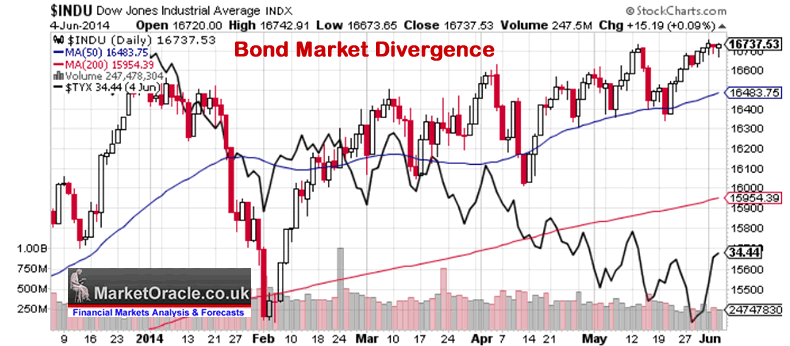
Just as we are currently experiencing, low stock market volatility can continue to persist for some time, in today's case we are approaching 2 months of low market volatility that having bled the bears dry and also probably kept many bulls on the side-lines who have been waiting for the anticipated correction to materialise. Therefore the market is ripe for a reaction / VIX spike higher with the accompanying spike lower in stock prices. So the VIX is warning of an imminent, significant correction. SEASONAL ANALYSIS - As per my last analysis (Feb) the upwardly sloping trading range for 2014 is materialising, there is nothing to suggest that this pattern looks set to be break. The seasonal tendency is for stocks to rally into Mid July before trending lower into late September. Given the price pattern to date and expectations for an earlier correction means we may get the MAIN correction / downtrend LATER i.e. starting towards the end of August, which suggests a mild correction into Mid July, Rally into late August and then a severe downtrend into the seasonally weakest months of the year Sept / October. What this also implies is that June should end the month BELOW where it started, something to ponder on as stocks rally continues. INTERMARKETS ANALYSIS - BONDS - What apparently continues to flummox the bears is the fact that both stocks and bond prices are rising (falling yields) when the consensus expectations are for these markets to trend in opposite directions i.e. rising stock prices imply a strengthening economy which implies market interest rates should be rising. However, as I have pointed out numerous times over the years and to be frank which should be obvious to everyone is that BOTH bond and stock markets have been heavily supported by central banks since the policy if zero interest rates began in late 2008. Off course something's got to eventually give, as the Fed cannot just buy ALL of the bonds without triggering a dollar collapse. So my consistent opinion is for market interest rates to rise which contrary to consensus expectations will NOT result in a termination of the stocks bull market NOR the more recent housing bull markets.
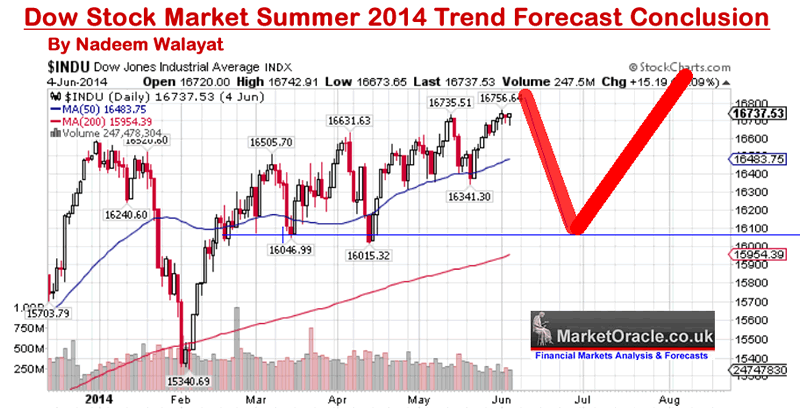
At the end of the central bank money printing is highly inflationary which is good for stocks and bad for bonds, and as markets discount the future the flow will likely be from bonds to stocks long before official interest rates start to rise. Formulating a Stock Market Forecast Clearly the current rally is living on borrowed time, it is running out of steam, it is uncertain whether the Dow will reach 17k before turning lower. In terms of Time the rally could end either today, tomorrow or cling on for as long as another couple of weeks. So a correction of sorts is due that will likely see June end well below the start of the month. How low could the correction go ? Well failure of 'Sell in May and Go Away' has upset the apple cart a bit, basically Sell in May now looks set to take place in June. So what many expected to start in May now starts in June which implies a relatively minor correction with the main one to come along later when the stock market has better set itself up for such a deeper correction that takes it Down during September and into Mid October, but that's for a future in-depth analysis. So this analysis is converging towards expectations for an imminentish correction towards a target of Dow 16k. It would be great if such a correction timed off a rally break of Dow 17k, but it may just not manage to make it that far i.e. we could see the Dow rally splutter out around Dow 16,900, which would set the scene for a second run at Dow 17k during August. Stock Market Forecast Conclusion The final conclusion for the Stock Market is for the Dow's rally to shortly terminate just before reaching 17k, probably at around Dow 16,950, then for the Dow to target a swift downtrend in to the range of 16,200 to 16,000 that may even bottom before the end of June. Which would set the scene for the stock market's next assault on Dow 17k into early August as illustrated by the below forecast graph, a failure of which I imagine would subsequently prompt many perma bears to start screaming DOUBLE TOP at the top of their lungs on the likes of CNBC and regurgitated at length by the blogosfear.
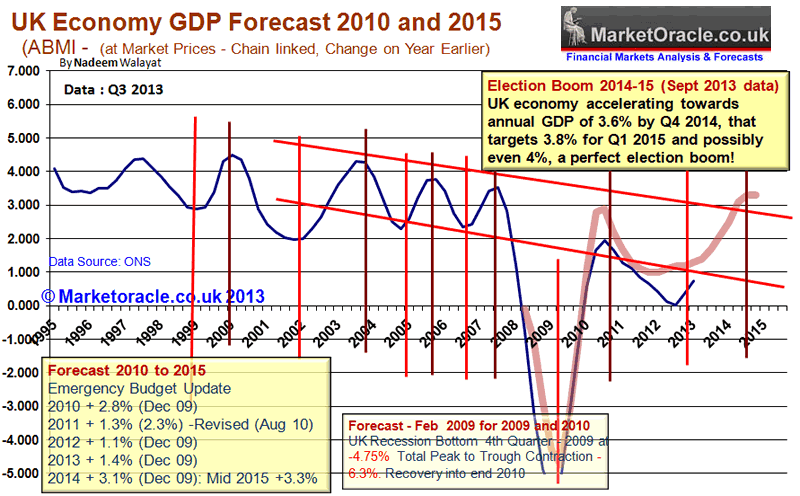
The August new high would set the scene for the real downtrend to begin into the seasonally weakest months of the year, but more on that in my next in-depth analysis, ensure you remain subscribed to my always free newsletter to get it in your email in box at the time. European Commission Advises Booming Britain to Burst Housing Market and Collapse UK Economy The clueless academics employed by the European Commission's political elite of the euro-zone, who for the glory of power over the european people are hell bent on driving much of the european union into the abyss of a socialist utopia where the masses own and earn nothing but become wholly reliant on ECB central bank money printing funded government hand outs as bought and paid for vested interests in exchange for votes for career european union politicians who have nothing in common with their electorates, today have been busy issuing advice to the one Island of Independence on a continent of conformity as to how Britain should ruin its booming economy European Commission Advises Britain to Ruin Its Economy In summary the EC recommends Britain burst its property market, collapse its economy and thus there will no longer be an immigration problem that prompts votes for UKIP as european workers would return to their home nations in receipt of ECB hand outs. Excerpted from "How to Ruin an Economy". HEREBY RECOMMENDS that the United Kingdom take action within the period 2014-2015 to: 1. Reinforce the budgetary strategy, endeavouring to correct the excessive deficit in a sustainable manner in line with the Council recommendation under the Excessive Deficit Procedure. Pursue a differentiated, growth-friendly approach to fiscal tightening by prioritising capital expenditure. To assist with fiscal consolidation, consideration should be given to raising revenues through broadening the tax base. Address structural bottlenecks related to infrastructure, skills mismatches and access to finance for SMEs to boost growth in the export of both goods and services. 2. Increase the transparency of the use and impact of macro-prudential regulation in respect of the housing sector by the Bank of England's Financial Policy Committee. Deploy appropriate measures to respond to the rapid increases in property prices in areas that account for a substantial share of economic growth in the United Kingdom, particularly London, for example by adjusting the Help to Buy 2 scheme and mitigate risks related to high mortgage indebtedness. Remove distortions in property taxation by regularly updating the valuation of property and reduce the regressivity of the band and rates within the council tax system. Continue efforts to increase the supply of housing. 3. Maintain commitment to the Youth Contract, especially by improving skills that meet employer needs. Ensure employer engagement by placing emphasis on addressing skills mismatches through more advanced and higher level skills provision and furthering apprenticeship offers. Reduce the number of young people with low basic skills. 4. Continue efforts to reduce child poverty in low-income households, by ensuring that the Universal Credit and other welfare reforms deliver adequate benefits with clear work incentives and support services. Improve the availability of affordable quality childcare. 5. Continue efforts to improve the availability of bank and non-bank financing to SMEs. Ensure the effective functioning of the Business Bank and support an increased presence of challenger banks. 6. Follow up on the National Infrastructure Plan by increasing the predictability of the planning processes as well as providing clarity on funding commitments. Ensure transparency and accountability by providing consistent and timely information on the implementation of the Plan. Done at Brussels, For the Council The President Britain's Booming Economy Britain's economy is literally booming with the academic economists that are liberally regurgitated in the mainstream press being busy revising Britains growth prospects up towards and some above 3% GDP, this whilst the euro-zone economy is actually slowing from an already poor level to stand at an annualised rate of just 0.8% with prospects of an continuing economic depression and even possible price deflation for many member states given a collective inflation rate of CPI 0.5%. My in-depth analysis of the UK housing market which included a UK GDP growth forecast concluded in the following expectation for 2014- 30 Dec 2013 - UK House Prices Forecast 2014 to 2018, The Debt Fuelled Election Boom Economic Growth Forecast 2013-2015 Therefore in terms of my economic growth conclusion, I expect the UK economy to at least attain a growth rate of 3.6% for 2014 and target 3.8% for Q1 2015 with a strong possibility of achieving the holy grail for election victories of announcing during the election campaign of 2015 that the UK economy at that time was growing at 4% per annum. Furthermore post election I expect that an over heating UK economy to slow as it dips back towards 3% over subsequent quarters of 2015.
Britain's economy has now entered the goldilocks zone of strong growth coupled with low official inflation that helps sedate the voting public into a mood of irrational exuberance. The economic data is inline with my forecast expectations for the UK economy to attain the holy grail of an 4% annual growth rate by the time of the next general election which with a year left to go literally sows the seeds for an outright conservative election victory. Another illustration of the huge and growing gap between a booming Britain and a euro-zone in depression are the unemployment rates, where despite out of control rampant immigration that has been sucking in job seekers right across the euro-zone, UK unemployment continues to tumble to currently stand at 6.8% which is set against an Euro-zone average unemployment rate of 11.7% and far worse in many states such as the 25% economic collapse rates in Spain and Greece, with youth unemployment at an revolution inducing near 60% that without ECB Euro single currency money printing backing would by now be experiencing an hyperinflationary collapse if they had their own domestic currencies to print. It appears the euro-crats fear an increasingly UKIP independant Britain not only because the people of Britain appear determined to force our corrupt and inept politicians to put Britain on the path towards an exit from the European Union but that Britain acts as a lightening rod around which other western euro-zone member states are clustering as their populations also start to demand freedom from the Euro-crat dictatorship that ultimately risks a break-up of the euro-zone and then the european union, leaving behind a rump of eastern european begging bowl states. The bottom line is that the european union is inefficient and corrupt as like a reverse Midas it turns everything it turns from gold into brown stuff, it lumbers businesses with regulations that force them to under perform and under employ as most recently illustrated by the madness of allowing fellow european union criminals to have records of their crimes deleted from search engines and online directories such as Google. Why UK House Prices are Rising It makes one wonder the magnitude of the detachment between those at the European Commission and the member states if they thought that their recommendations of bursting the UK property market would ever be seriously considered. For the REAL reason why UK house prices are soaring into the stratosphere is because of INCOMPETENT and corrupt European Union institutions such as the European Commission that have destroyed large areas of the Euro-zone economy thus triggering approx 400,000 workers and their families per year to seek to migrate to the UK thus forcing UP UK HOUSE PRICES! The sooner Britain exits from the European Union the better because these fools at the European Commission are DANGEROUS! They live in a fantasy land where their actions will DESTROY the continent and Britain along with it if we are still connected to its institutions at that time. For more on the prospects for the UK economy and house prices over the next 5 years see the New UK Housing Market Ebook available for FREE DOWNLOAD (Only requirement is a valid email address).
The housing market ebook of over 300 pages comprises four main parts : 1. U.S. Housing Market Analysis and Trend Forecast 2013-2016 - 27 pages The US housing market analysis and concluding trend forecast at the start of 2013 acted as a good lead exercise for the subsequent more in-depth analysis of the UK housing market. 2. U.K. Housing Market Analysis and House Prices Forecast 2014-2018 - 107 pages The second part comprises the bulk of analysis that concludes in several detailed trend forecasts including that for UK house prices from 2014 to 2018 and their implications for the outcome of the next General Election (May 2015) as well as the Scottish Referendum. 3. Housing Market Guides - 138 Pages Over 1/3rd of the ebook comprises of extensive guides that cover virtually every aspect of the process of buying, selling and owning properties, including many value increasing home improvements continuing on in how to save on running and repair costs with timely maintenance tasks and even guides on which value losing home improvements should be avoided.
These guides will further be supplemented from Mid 2014 onwards by a series of online videos and regularly updated calculators such as the Home Buying Profit and Loss Calculator, which will seek to give calculations on whether to buy or rent based on personal individual circumstances, that will be updated to include the latest expected trend trajectories for future house price inflation i.e. you will have your own personal house price forecast. 4. Historic Analysis 2007 to 2012 - 40 pages A selection of 10 historic articles of analysis to illustrate the process of analysis during key stages of the housing markets trend from the euphoric bubble high, to a state of denial as house prices entered a literal free fall, to the depths of depression and then emergence of the embryonic bull market during 2012 that gave birth to the bull market proper of 2013. FREE DOWNLOAD (Only requirement is a valid email address) Your 'Sell in June' analyst. Source and comments: http://www.marketoracle.co.uk/Article45917.html By Nadeem Walayat Copyright © 2005-2014 Marketoracle.co.uk (Market Oracle Ltd). All rights reserved. Nadeem Walayat has over 25 years experience of trading derivatives, portfolio management and analysing the financial markets, including one of few who both anticipated and Beat the 1987 Crash. Nadeem's forward looking analysis focuses on UK inflation, economy, interest rates and housing market. He is the author of five ebook's in the The Inflation Mega-Trend and Stocks Stealth Bull Market series that can be downloaded for Free.
Disclaimer: The above is a matter of opinion provided for general information purposes only and is not intended as investment advice. Information and analysis above are derived from sources and utilising methods believed to be reliable, but we cannot accept responsibility for any trading losses you may incur as a result of this analysis. Individuals should consult with their personal financial advisors before engaging in any trading activities.
You're receiving this Email because you've registered with our website. How to Subscribe Click here to register and get our FREE Newsletter To access the Newsletter archive this link Forward a Message to Someone [FORWARD] To update your preferences [PREFERENCES] How to Unsubscribe - [UNSUBSCRIBE]
The Market Oracle is a FREE Financial Markets Forecasting & Analysis Newsletter and online publication. |
||||||||||||||||
© 2005-2022 http://www.MarketOracle.co.uk - The Market Oracle is a FREE Daily Financial Markets Analysis & Forecasting online publication.


