Stock Market Top -Bear Market Begins
Stock-Markets / Stocks Bear Market Oct 02, 2014 - 09:31 PM GMTBy: Dan_Stinson
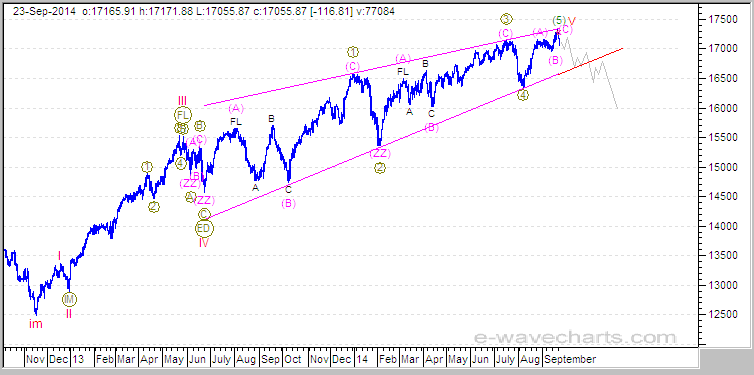
 DOW reversal after completing ED pattern
The DOW was in an Ending Diagonal pattern which we have followed for many months before the recent downside. The chart below is from our members page and illustrates the completed pattern on Sept 23rd indicating a stock market top. On Friday Sept 19th, it appeared that the market top was likely in place, but we confirmed the reversal on Monday Sept 22nd.
The forecast for the reversal was also supported by many other indices that we follow. There was the negative divergence with the Russell 2000 that we have been following and the recent development with the "death cross" of the moving averages on this index also supports the forecast. There are many other charts that have completed Ending Diagonal patterns over the past few months. These charts include the CAC 40, AORD, FTSE, HSI, and wave (2) for the HGX.
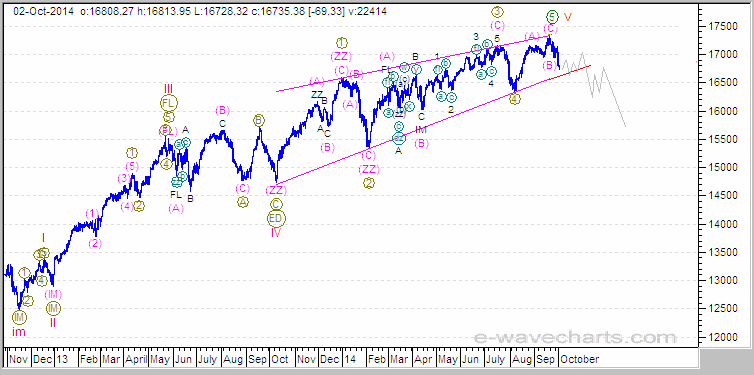
We do have a few lower trendlines on the indices that have not yet been broken, but when these lines are broken they will add further support to the forecast. The first lower trendline is illustrated on the the DOW chart below, so we can monitor the action at this red line for further confirmation.

We can see that the current action is approaching this lower trendline on the updated DOW chart below. We could see a small wave (2) bounce at this trendline before it breaks lower.

We have also discussed bubbles and parabolic advances in past newsletters and the rally from the the 2009 low did go parabolic. Parabolic advances can't be sustained and always end poorly, with the price usually falling to or below the starting point of the parabolic move. What goes straight up, always comes straight down faster and usually further.
We can monitor these lower trendlines on the indices for further confirmation on the reversal.
These charts are only a guide so that you can follow the action and monitor the expected outcome. The action could play out exactly as illustrated or it may need minor adjustments as we follow it through.
If you are interested in viewing these updated charts and other detailed charts with targets on a daily basis, please see the registration details below.
Elliott Wave Chart Site - IntraDay Market Updates on the DOW, Nasdaq, S&P500, Gold, Silver, HUI and the USD.
To learn more on the status of Gold, Silver, HUI and the USD, please visit the link below for registration details. The commentary and forecasts are updated daily, including intraday commentary and chart updates. Fibonacci pivot dates and cycle analysis are also utilized to forecast reversal dates. The indices covered include the NASDAQ, DOW, S&P 500, SOX, Nikkei, DOW Transports, TSX, BSE, KSE, AORD, HSI, DAX and FTSE. Commodity charts include Copper, XOI, Crude Oil, Nat Gas, Gold, GLD ETF, Silver, SLV ETF, HUI and/or the XAU (Gold and Silver index). Additional Elliott Wave charts cover the US Dollar (USD), EURO FXE ETF, Canadian Dollar (CAD) FXC ETF, 10 Year Treasury Note Yield (TNX), Bank Index (BKX)
With market timing and Elliott Wave Forecasts, we can be on the right side of the market.
Happy Trading!!!
Dan Stinson
Elliott Wave Chart Site e-wavecharts.com
(AEM) and Denison Mines.
Dan Stinson Archive |
© 2005-2022 http://www.MarketOracle.co.uk - The Market Oracle is a FREE Daily Financial Markets Analysis & Forecasting online publication.


