


Dow Stocks Index And The No Mercy Cycle
Stock-Markets / Stock Markets 2014 Oct 01, 2014 - 03:44 PM GMTBy: Austin_Galt

 The Dow hit an all time high at 17350 on the 19th September and there now seem to be many saying that is it - the bull market is done and the next great bear market is upon us. I disagree. For now, anyway. Let's investigate taking a bottom up approach beginning with the daily chart.
Dow Daily Chart
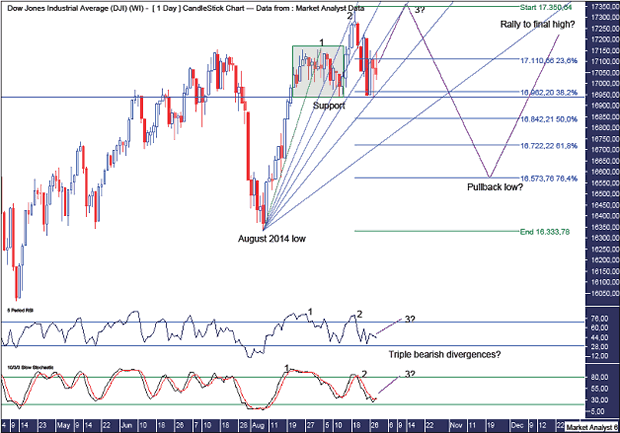
The green highlighted rectangle shows the consolidation zone which occurred towards the end of August until mid September. The high of this consolidation zone was a new all time high at 17161 just above the previous July high. This is denoted by the number 1. The low of this area was set at 16937. This is denoted by the horizontal line labelled Support. Shortly thereafter, price shot upwards to a new all time high at 17350 on the 19th September and is denoted by the number 2.
Price subsequently fell hard but seems to have pulled up around the support line. It was a whisker below at 16934 and turning up here creates a little double bottom with the trend. That should lead to one last high. Breaking down below this support line now would look bearish.
A common topping pattern involves three marginally higher highs. This is more obvious when the three highs are all spike highs. However, the first top is often part of a consolidation with the final two tops being spike highs. This is what I suspect is occurring here. We already have the high as part of a consolidation and one spike high. All that is required now is the second spike high (3?).
I have added a Fibonacci Fan which shows some excellent symmetry being exhibited by price. The recent all time high found resistance at the 23.6% angle while the recent low found support at the 61.8% angle. Not to mention several other minor turning points including today where price turned back down right at the 50% angle.
It might be hard now for price to get above a higher angle so perhaps price trades within the 50% and 61.8% angles with the third and final marginal high to occur at the resistance given from the 50% angle. Price trading at new all time highs around the 50% angle in the second week of October may provide a great opportunity to take out short positions near the top.
I have added the Relative Strength Indicator (RSI) and Stochastic indicator which both show the potential for a triple bearish divergence on the next high. Each new high is losing strength. A significant decline could be expected after this next high. However, I suspect that may not be the end of the bull market.
I have added Fibonacci retracement levels of the move up from the August low to all time high. Keep in mind I think we have a little higher to go but not enough to significantly alter this analysis. I will be looking for price to find support after a deep pullback, possibly back to the 76.4% level. After that, there may be one final rally to new highs to finish off the bull trend. At least a test of the highs. Let's see.
As for the timing aspect, the planetary constellations based Bradley Model seems to be currently in-synch with the Dow Jones Industrial Index with the last two major turn dates of 1st January 2014 and 16th July 2014 having coincided with the tops of 31st December 2013 and 17th July 2014. The next major Bradley Model turn date is 20th November so perhaps price goes up into top in early October before going down into that date and then reversing higher once again.
Price trading below the August 2014 low at 16333 would most likely be confirmation the bear market is on.
Now let's look at the bigger picture using the monthly and yearly charts.
Dow Monthly Chart
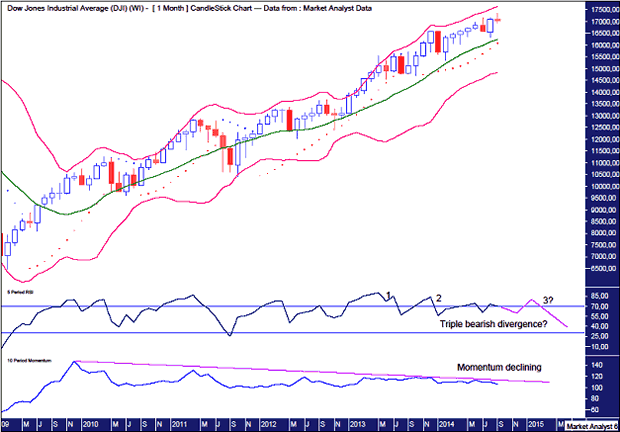
This chart shows the bull market that has been in force since the 2009 low. I have added Bollinger Bands which show price generally staying between the top and middle bands. Only once in more than 5 years did price actually break down to the lower band. Solid stuff.
While price looks to be in a solid position, there are ominous signs elsewhere.
The RSI shows this coming top to be potentially accompanied by a fourth bearish divergence. So perhaps price reverses down in October but then rallies in the following months to new highs and the RSI sets up a triple bearish divergence. That is, the RSI reading on the new high will still be lower than that of the December 2013 high. Time will tell.
The Momentum indicator shows the bull trend has virtually run out of puff. Momentum has been declining since the 2009 high. The game is just about up. Tick tock.
I have added a Parabolic Stop and Reverse (PSAR) indicator which pertains to the dots and retains a bullish bias. Busting the dots to the downside will be one potential sign that the bull market is over. Those dots currently stand at 16085 and will move up to over 16300 for the month of October.
Dow Yearly Chart
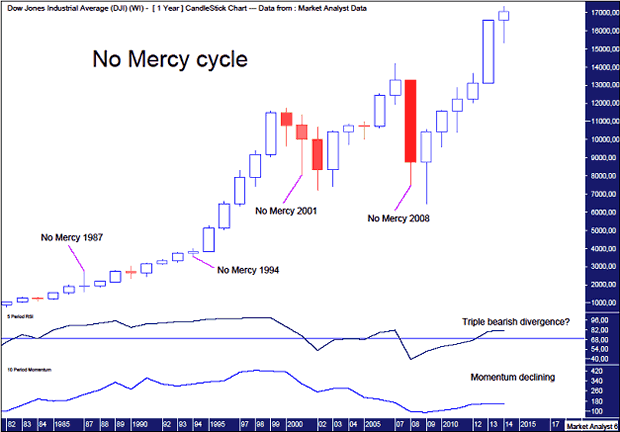
I have applied the same indicators from the monthly chart to the yearly chart. If the monthly chart didn't give you heebie jeebies, then this chart will surely go close.
The RSI looks to set up a triple bearish divergence on the next yearly top. That top could be this year or next year. If it is next year then price will obviously have to reverse and close the year in negative territory.
The Momentum indicator shows a massive drop from the 1999/2000 highs. It may not appear so going by price action, but this market is struggling!
And yet another ominous sign is the emergence of what I call the No Mercy cycle. This revolves around the 7 year cycle and the No Mercy part of that is set to hit next year in 2015. Let's run through it.
I have shown the No Mercy cycle years on the chart. The last time it hit was in 2008 and we all know what happened then. Before that was in 2001 which was also a negative year after being down around 25% at one stage. Before that was in 1994. This was in the middle of a massive bull market yet this year was only able to eke out a gain of less than 3%. For that type of market, that was a merciless year for the bulls! Price exploded as soon as that year was over. The No Mercy cycle before that was in 1987 - another crash year.
And so we approach another No Mercy cycle year in 2015. I, for one, again expect no mercy for the bulls.
By Austin Galt
Austin Galt is The Voodoo Analyst. I have studied charts for over 20 years and am currently a private trader. Several years ago I worked as a licensed advisor with a well known Australian stock broker. While there was an abundance of fundamental analysts, there seemed to be a dearth of technical analysts. My aim here is to provide my view of technical analysis that is both intriguing and misunderstood by many. I like to refer to it as the black magic of stock market analysis.
© 2014 Copyright The Voodoo Analyst - All Rights Reserved
Disclaimer: The above is a matter of opinion provided for general information purposes only and is not intended as investment advice. Information and analysis above are derived from sources and utilising methods believed to be reliable, but we cannot accept responsibility for any losses you may incur as a result of this analysis. Individuals should consult with their personal financial advisors.
© 2005-2022 http://www.MarketOracle.co.uk - The Market Oracle is a FREE Daily Financial Markets Analysis & Forecasting online publication.