Dow Transports Hitting New All-time Highs
Stock-Markets / Elliott Wave Theory May 19, 2008 - 08:39 AM GMTBy: Joseph_Russo
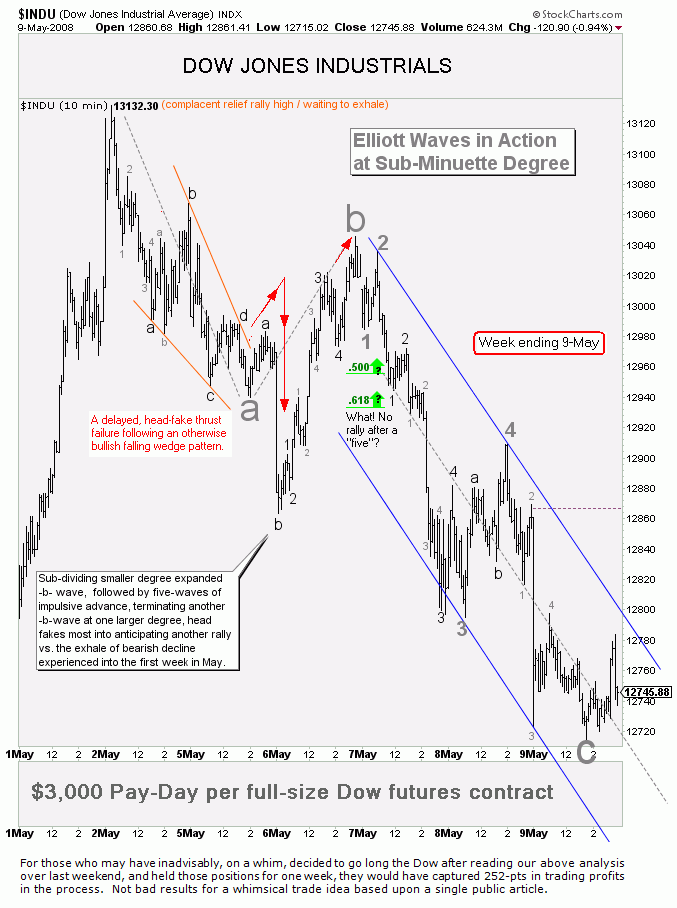
 Before we begin our look at the roaring Transportation average, we would like to return your attention to our previous week's article entitled “ Spring-Break ”. Last week's piece did a fine job of calling a precise short–term tradable low in the Dow.
Below we re-present the chart from last week's article. Within that article, previous guidance suggested, “For select traders, proprietary criteria also provided another exit or potentially early reversal signal near the close at 12734.” The follow-up chart illustrates how the reversal signal turned out to be a rather precise one, and by no means early.
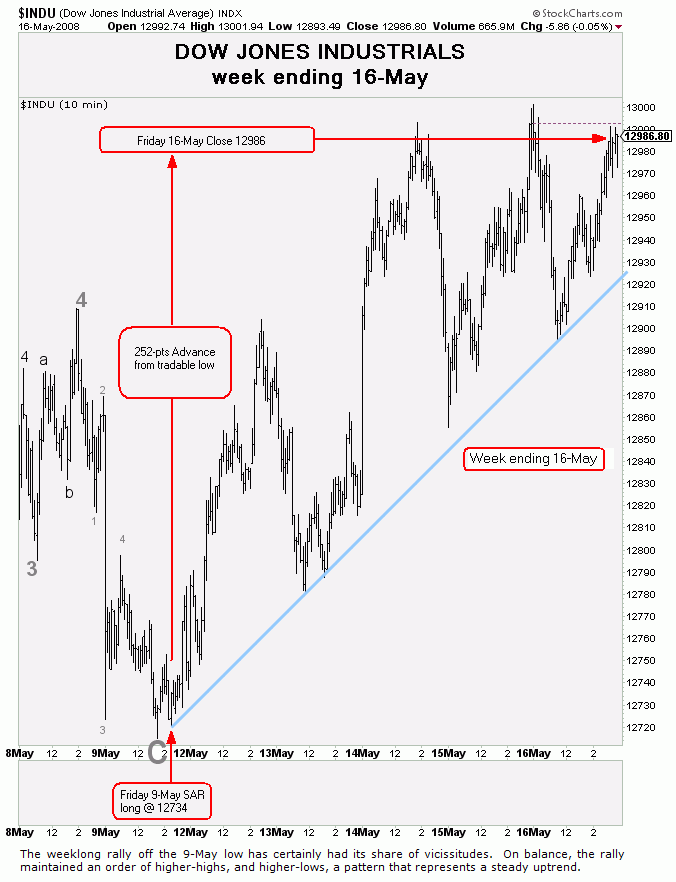
The chart below shows what happened in the Dow following the SAR (stop and reverse long) signal at the close of 9-May. If no one else did, at least the market heeded our call, and that is all that matters to our active trading clientele.
We continue to monitor and reconcile the Dow's wave counts, price targets, and turn-dates for NTO traders. This week however, we wish to draw readers' attention to a quick study of the Transportation Average from an Elliott Wave perspective.
Beam ‘em Up Scotty
Since the January 2008 low, it appears that an invisible hand has slid the ships transporter lever to “energize” status in the Transportation Average. Suddenly leading the renewed bullish charge, the Transports are striking fresh all-time highs. Whether the charge is one of sustainable new leadership or one of false prophets will soon reveal itself in the near-term price action.
Amid the backstop of intervention, there is no doubt that a rising level of complacency has returned to many equity indices. Whether such complacency will return to the sheer bullish arrogance of day's past is a bet the bulls hope to win. In the interim, we will let the price action guide us through such deliberations.
Standard Analytical Format @ EWT (Elliott Wave Technology)
Since we do not cover the Transports in any of our subscription services, we thought it prudent for both our clients and broader readership to gain a quick Elliott Wave perspective on the roaring Transports.
Considering their leadership in striking fresh historic highs, either the balance of the lagging majors will follow, or the Transports will soon buckle and come tumbling down to join their brethren indices.
As we do with all markets covered in our publications, we will begin this quick scan of the Trannies from the longest time horizon and work our way down the shortest.
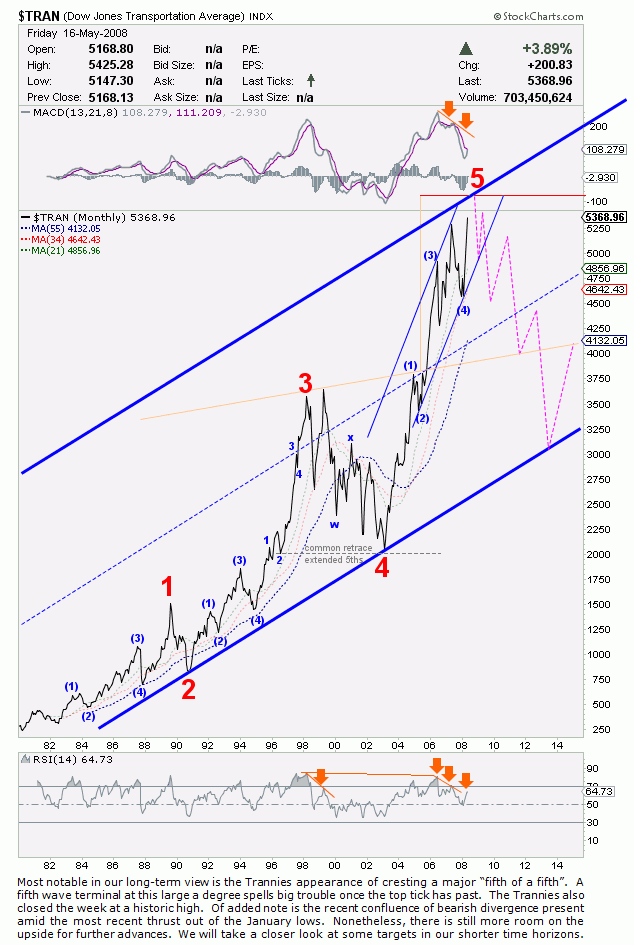
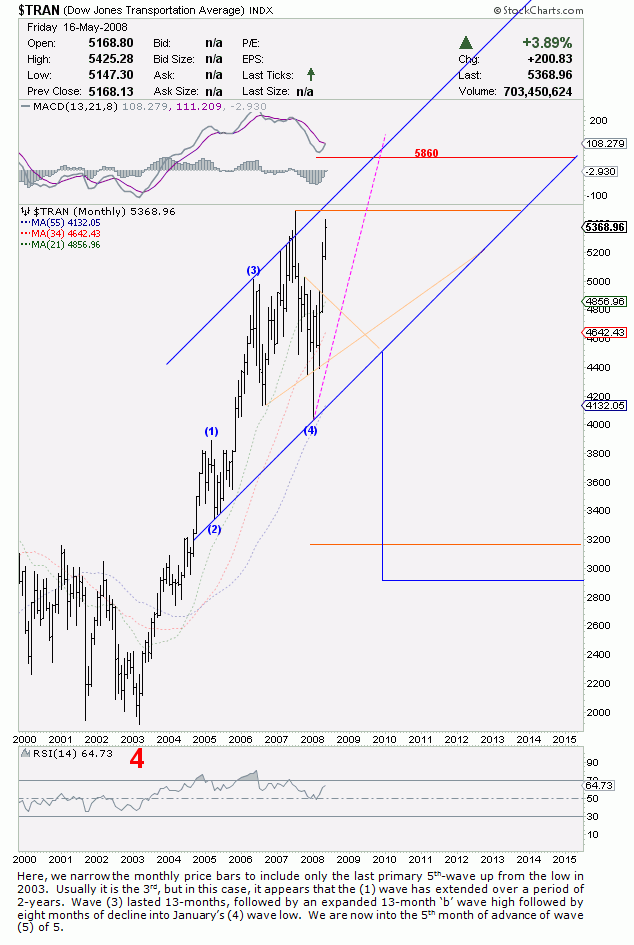
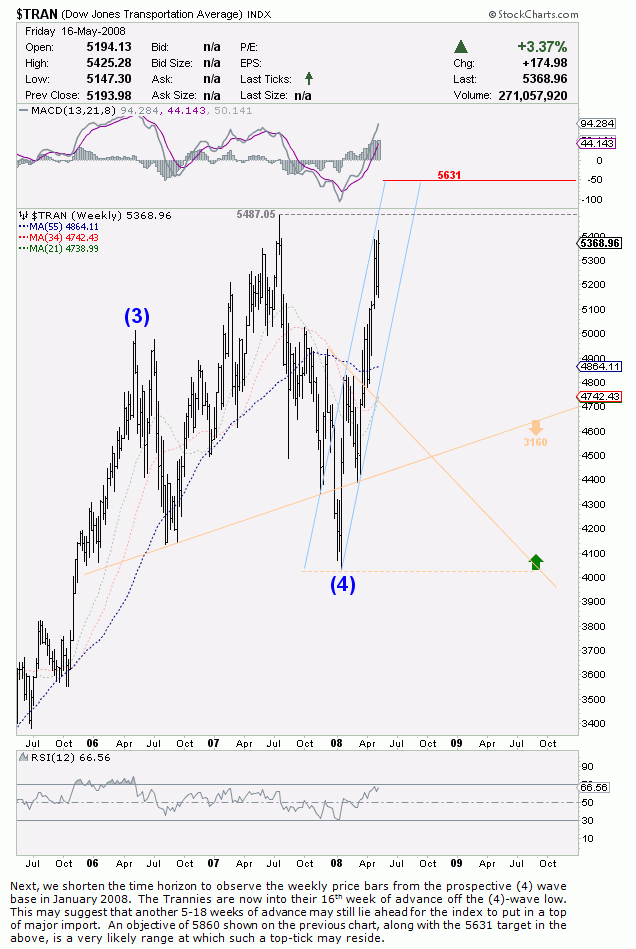
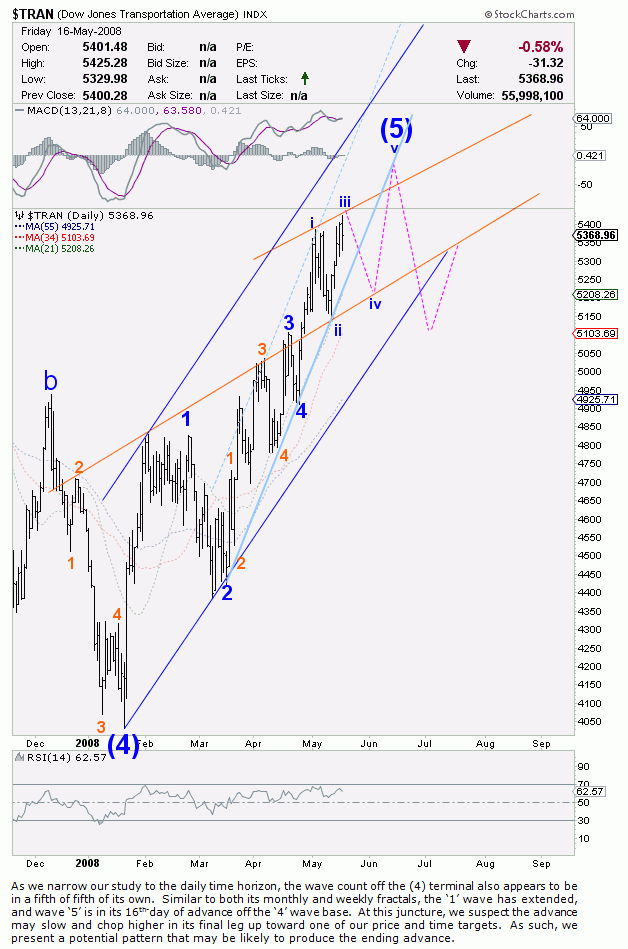
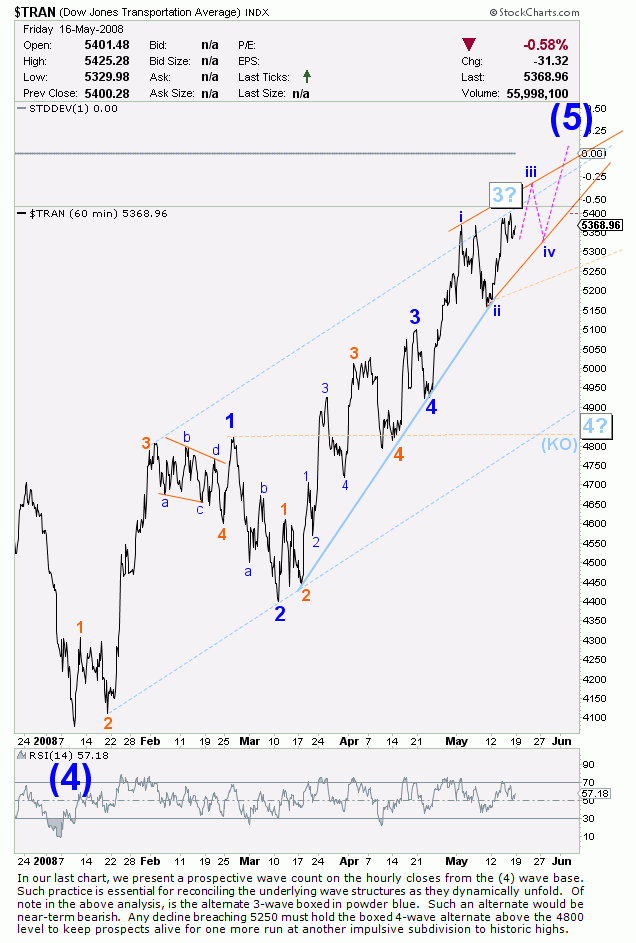
We hope that you might benefit from, and have enjoyed this rather quick look at the Dow Jones Transportation average. At some point in the future, we shall provide an update to this article to see how things are shaping up for the Trannies.
Our daily coverage of the Dow, S&P-500, and NDX-100 is much more exhaustive than the basic five-chart format presented above. In addition to the above, we also include turn-bar studies, 60-minute, 30-minute, and 10-minute price charts complete with a full array of price targets, and counter-trend trade entry alerts.
Come spend the summer with Elliott Wave Technology ……And you may never again trade the indices without us-
The express focus of Elliott Wave Technology's charting and forecasting services is to keenly observe, monitor, and anticipate the future course of broad market indices over the short, intermediate, and long-term.
Each broad data-set under study, whether an intraday 10-minute price chart, or a yearly bar chart spanning hundreds of years, is assessed by its current and historical face-value regardless of composition changes, or underlying currency dynamics.
We vigorously observe standard charting protocol, in concert with classic application and adherence to the exceptionally accurate navigational benefits provided by the proper application and classic tenets of Elliott Wave Theory.
Although Elliott Wave Theory is by no means a trading system, it is the best tool - bar-none, from which to anticipate future price direction most accurately across all time horizons.
Should one have interest in acquiring access to our long-term technical analysis and/or utilizing our proprietary short-term market landscapes, we invite you to visit our web site for more information. For immediate access to our broad market coverage in all time-horizons, one may subscribe directly to the Near Term Outlook .
One last thing to remember, never fight the fed nor trust them either.
Trade Better / Invest Smarter...
By Joseph Russo
Chief Editor and Technical Analyst
Elliott Wave Technology
Email Author
Copyright © 2008 Elliott Wave Technology. All Rights Reserved.
Joseph Russo, presently the Publisher and Chief Market analyst for Elliott Wave Technology, has been studying Elliott Wave Theory, and the Technical Analysis of Financial Markets since 1991 and currently maintains active member status in the "Market Technicians Association." Joe continues to expand his body of knowledge through the MTA's accredited CMT program.
Joseph Russo Archive |
© 2005-2022 http://www.MarketOracle.co.uk - The Market Oracle is a FREE Daily Financial Markets Analysis & Forecasting online publication.


