


Silver Price At or Very Close to an Important Low
Commodities / Gold and Silver 2014 Sep 29, 2014 - 02:09 PM GMTBy: Clive_Maund

 Many investors have been freaked out by silver's recent breakdown from a Descending Triangle and the sharp drop that followed, but as we will see this morning there is now a strong case to make for silver either being at its low for this cycle, or very, very close to it.
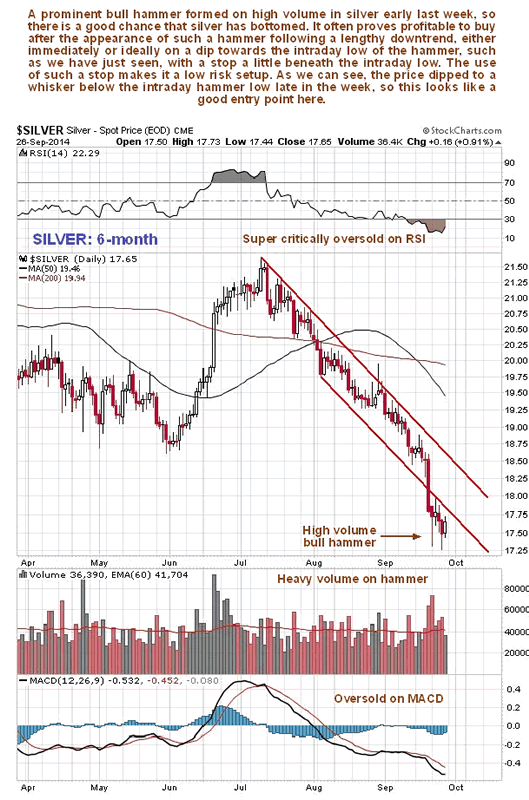
We'll start by looking at silver's 6-month chart, on which we can see its recent action in detail. Here we see the breakdown from the Triangle (shown on the 4-year chart below) and the resulting sharp drop. This drop is now regarded as a final capitulation following the long and grueling downtrend that preceded it. Note the pronounced high volume bull hammer that occurred early last week. There is a good chance that this marks the final bottom, and if not, we are considered to be very close to it. This hammer was followed the next day by a "spinning top" candlestick, a sign of indecision and another sign that the downtrend has exhausted itself.
You may recall that it was stated in the Silver update posted on the site a couple of days ago that "Traders wanting to buy here have a low risk setup, as silver may be bought here, or ideally on a short-term dip towards the hammer intraday low, with a stop a little below the low of the hammer." Well, the price has since drifted back to the vicinity of the hammer low, and on Thursday dropped to a whisker below it intraday, and this may turn out to be a near perfect entry point. Before leaving the 6-month chart, note how horribly oversold silver is on its short-term oscillators after its prolonged downtrend, especially its RSI which shows it to be super-critically oversold.
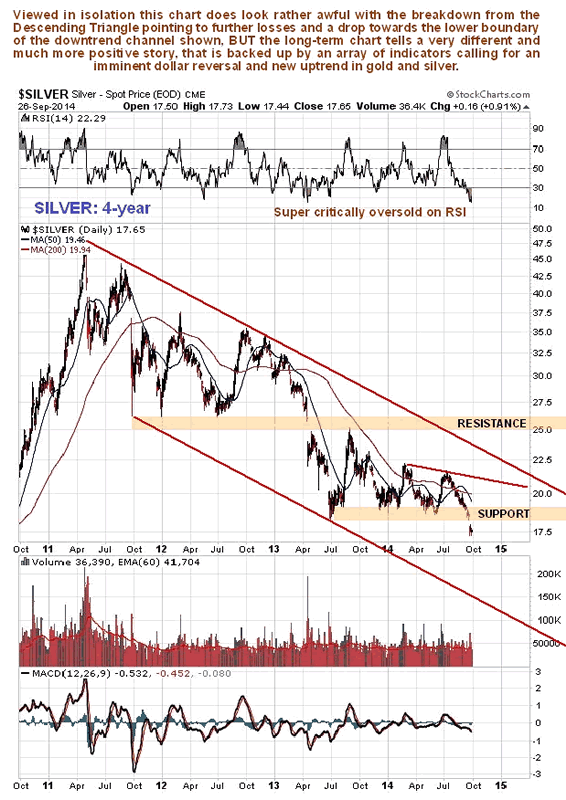
Now let's see what has got so many traders freaked out on the 4-year chart. On this chart we can see the breakdown from the Descending Triangle which has been forming from late June last year. We can readily understand why this has got so many people worried as it looks like silver is starting another heavy downleg just going on this chart, but before we join this crowd, let's quickly move on to consider why this breakdown is believed to be a bear trap, and why the bullish case for silver is now strong.
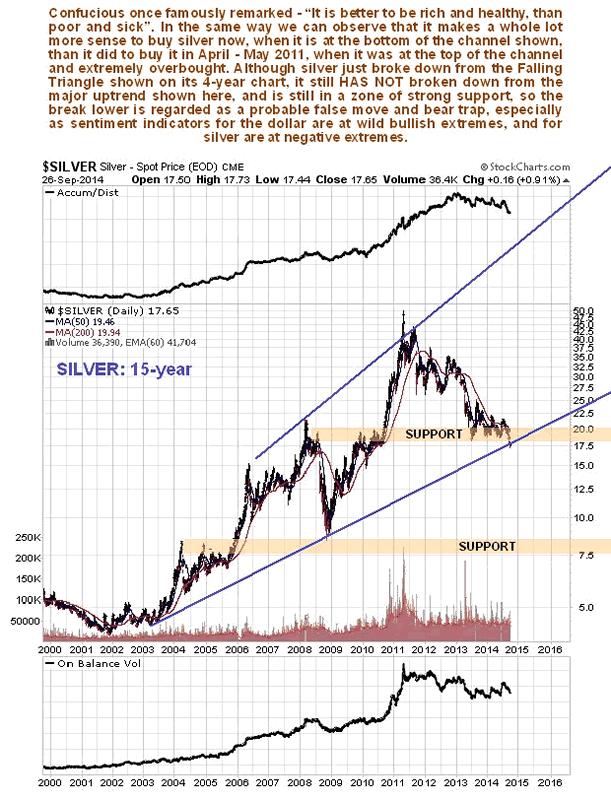
The 15-year chart presents the other side of the story, as it reveals that silver has still not broken down from its long-term uptrend in force from 2003 and is still in a zone of major support arising from the extensive trading in this price zone in 2008 and again in late 2009 and 2010. This chart makes plain that while silver has certainly been in a bearmarket from April - May 2011, in the larger scheme of things this may only be a severe correction within an ongoing major bullmarket.
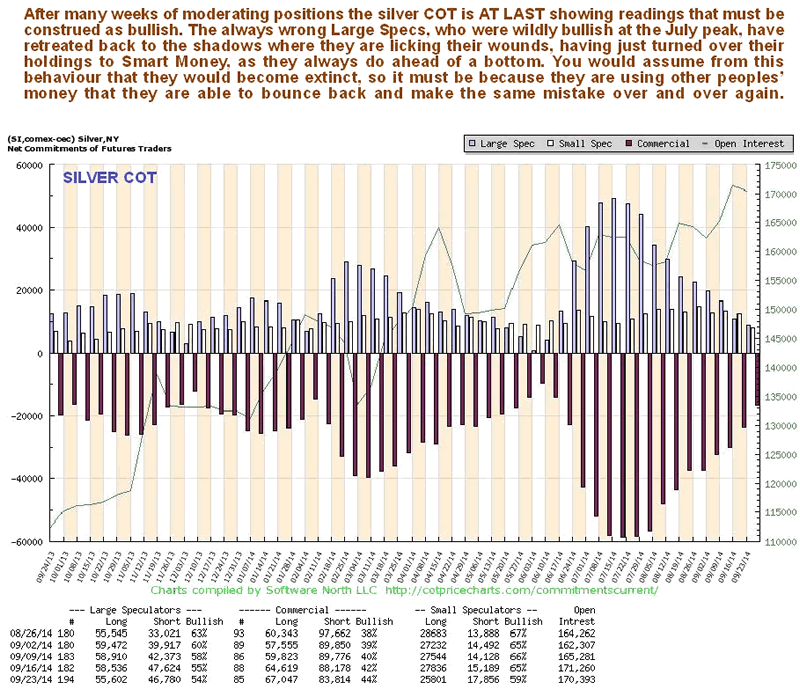
Now let's move on to see what the latest COT and sentiment indicators have to see about silver at this juncture. In a word, sentiment towards silver stinks - it is absolutely awful, and the number of people that you know who are bullish on silver you can probably count on the fingers of one hand - this is the classic extreme of negative sentiment that is the hallmark of a bottom.
The standard silver COT is now most encouraging. It shows that at last positions have eased to a low level that must be construed as bullish. The formerly enthusiastic Large Specs, who are always wrong, have given up and are out.
The silver hedgers chart (which is a form of COT chart that goes back further), shows that readings are now rapidly swinging into bullish territory.
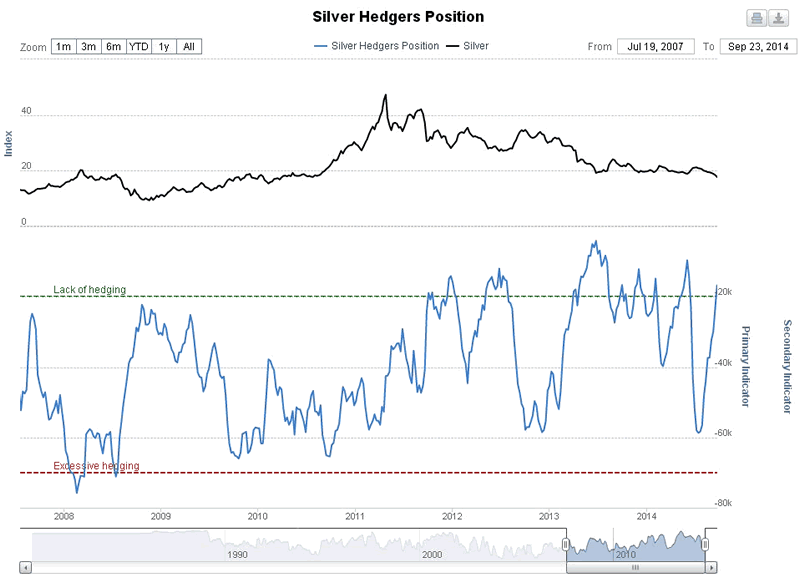
Chart courtesy of www.sentimentrader.com
Next we move on to the silver optix or optimism index where we see that sentiment is already at an extreme that in the past has already correlated with an important bottom, or been close to it. This chart alone makes a strong case for a silver bottom here.
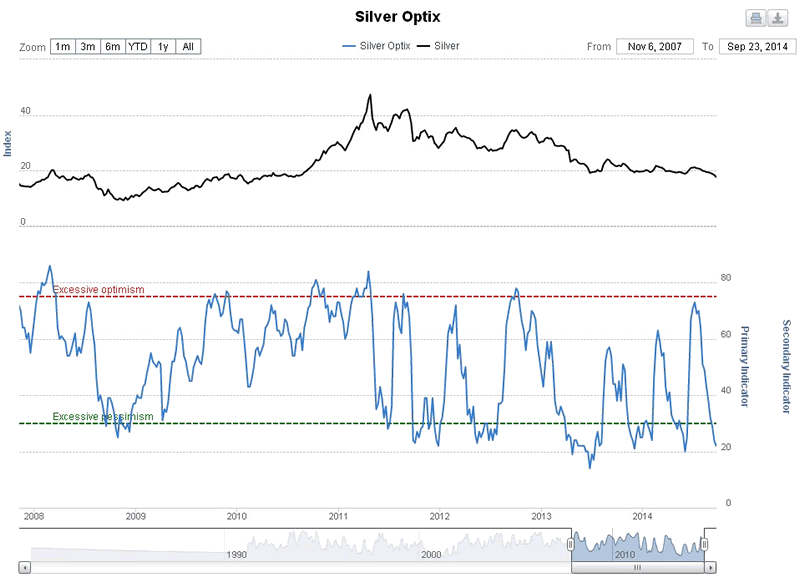
Chart courtesy of www.sentimentrader.com
While we normally look at the US dollar in gold updates only, it is so important to both metals and at such an extreme that we will include a look at it in this silver update.
Conclusion: although we have vacillated in the recent past - with good reason given that silver just made a new low, we can now emphatically conclude that silver is believed to be either at or very close to an important low here, especially as the dollar looks set to turn lower soon. Only in the event of an immediate all-out across the board deflationary plunge would silver prices be likely to drop further.
By Clive Maund
CliveMaund.com
For billing & subscription questions: subscriptions@clivemaund.com
© 2014 Clive Maund - The above represents the opinion and analysis of Mr. Maund, based on data available to him, at the time of writing. Mr. Maunds opinions are his own, and are not a recommendation or an offer to buy or sell securities. No responsibility can be accepted for losses that may result as a consequence of trading on the basis of this analysis.
Mr. Maund is an independent analyst who receives no compensation of any kind from any groups, individuals or corporations mentioned in his reports. As trading and investing in any financial markets may involve serious risk of loss, Mr. Maund recommends that you consult with a qualified investment advisor, one licensed by appropriate regulatory agencies in your legal jurisdiction and do your own due diligence and research when making any kind of a transaction with financial ramifications.
Clive Maund Archive |
© 2005-2022 http://www.MarketOracle.co.uk - The Market Oracle is a FREE Daily Financial Markets Analysis & Forecasting online publication.