Most Popular
1. It’s a New Macro, the Gold Market Knows It, But Dead Men Walking Do Not (yet)- Gary_Tanashian
2.Stock Market Presidential Election Cycle Seasonal Trend Analysis - Nadeem_Walayat
3. Bitcoin S&P Pattern - Nadeem_Walayat
4.Nvidia Blow Off Top - Flying High like the Phoenix too Close to the Sun - Nadeem_Walayat
4.U.S. financial market’s “Weimar phase” impact to your fiat and digital assets - Raymond_Matison
5. How to Profit from the Global Warming ClImate Change Mega Death Trend - Part1 - Nadeem_Walayat
7.Bitcoin Gravy Train Trend Forecast 2024 - - Nadeem_Walayat
8.The Bond Trade and Interest Rates - Nadeem_Walayat
9.It’s Easy to Scream Stocks Bubble! - Stephen_McBride
10.Fed’s Next Intertest Rate Move might not align with popular consensus - Richard_Mills
Last 7 days
Friday Stock Market CRASH Following Israel Attack on Iranian Nuclear Facilities - 19th Apr 24
All Measures to Combat Global Warming Are Smoke and Mirrors! - 18th Apr 24
Cisco Then vs. Nvidia Now - 18th Apr 24
Is the Biden Administration Trying To Destroy the Dollar? - 18th Apr 24
S&P Stock Market Trend Forecast to Dec 2024 - 16th Apr 24
No Deposit Bonuses: Boost Your Finances - 16th Apr 24
Global Warming ClImate Change Mega Death Trend - 8th Apr 24
Gold Is Rallying Again, But Silver Could Get REALLY Interesting - 8th Apr 24
Media Elite Belittle Inflation Struggles of Ordinary Americans - 8th Apr 24
Profit from the Roaring AI 2020's Tech Stocks Economic Boom - 8th Apr 24
Stock Market Election Year Five Nights at Freddy's - 7th Apr 24
It’s a New Macro, the Gold Market Knows It, But Dead Men Walking Do Not (yet)- 7th Apr 24
AI Revolution and NVDA: Why Tough Going May Be Ahead - 7th Apr 24
Hidden cost of US homeownership just saw its biggest spike in 5 years - 7th Apr 24
What Happens To Gold Price If The Fed Doesn’t Cut Rates? - 7th Apr 24
The Fed is becoming increasingly divided on interest rates - 7th Apr 24
The Evils of Paper Money Have no End - 7th Apr 24
Stock Market Presidential Election Cycle Seasonal Trend Analysis - 3rd Apr 24
Stock Market Presidential Election Cycle Seasonal Trend - 2nd Apr 24
Dow Stock Market Annual Percent Change Analysis 2024 - 2nd Apr 24
Bitcoin S&P Pattern - 31st Mar 24
S&P Stock Market Correlating Seasonal Swings - 31st Mar 24
S&P SEASONAL ANALYSIS - 31st Mar 24
Here's a Dirty Little Secret: Federal Reserve Monetary Policy Is Still Loose - 31st Mar 24
Tandem Chairman Paul Pester on Fintech, AI, and the Future of Banking in the UK - 31st Mar 24
Stock Market Volatility (VIX) - 25th Mar 24
Stock Market Investor Sentiment - 25th Mar 24
The Federal Reserve Didn't Do Anything But It Had Plenty to Say - 25th Mar 24

Market Oracle FREE Newsletter

How to Protect your Wealth by Investing in AI Tech Stocks

Stock Market Beyond Belief

Stock-Markets / Stock Markets 2014 Sep 24, 2014 - 01:38 PM GMT

By: Ed_Carlson

Stock-Markets

Last week's commentary, Beyond all Doubt, quickly turned to 'beyond belief' as the Dow exceeded its July 16 closing high. The market timing models of George Lindsay don't use the terms bull and bear market and I shouldn't have either. Rather his work speaks in terms of basic advances, basic declines, and basic cycles. Understanding the difference between these concepts was how he was able to make such incredible market calls during his career.


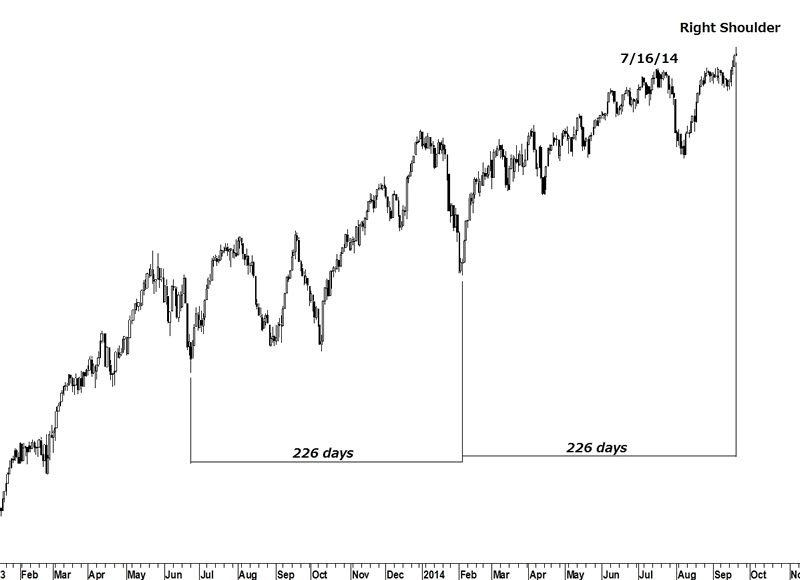
By 7/16/14 the basic advance from 11/25/11 had been ongoing for 964 days. Having reached the end of the longest of Lindsay's standard time spans, the basic advance had to end and the Dow did turn down from there, falling 770 points. Lindsay wrote that following an extended basic advance (929-968 days) the Dow always climbs into a right shoulder after the initial dip. Lindsay allowed for the possibility that a right shoulder can reach a level higher than the basic advance but it has been very rare to see that happen as it did last week.

The question now is 'where is the high of the right shoulder?' Lindsay wrote that an interval of 221-224 days (give or take) has occurred throughout the history of the Dow. This interval has made an appearance in every previous right shoulder formation. Today we can see one of Lindsay's lesser-known models, the low-low-high pattern, is pointing to a high last Friday (it could be off by a day or two). While this pattern can contain any number of days, in this instance it appears as 226 days - just as we are expecting a right shoulder. Consequently, I'm sticking to my bearish opinion and still expect the 2009 bull market to be over in the immediate future if not already.


Get your copy of the September Lindsay Report at SeattleTA.

Ed Carlson, author of George Lindsay and the Art of Technical Analysis, and his new book, George Lindsay's An Aid to Timing is an independent trader, consultant, and Chartered Market Technician (CMT) based in Seattle. Carlson manages the website Seattle Technical Advisors.com, where he publishes daily and weekly commentary. He spent twenty years as a stockbroker and holds an M.B.A. from Wichita State University.

© 2014 Copyright Ed Carlson - All Rights Reserved

Disclaimer: The above is a matter of opinion provided for general information purposes only and is not intended as investment advice. Information and analysis above are derived from sources and utilising methods believed to be reliable, but we cannot accept responsibility for any losses you may incur as a result of this analysis. Individuals should consult with their personal financial advisors.


© 2005-2022 http://www.MarketOracle.co.uk - The Market Oracle is a FREE Daily Financial Markets Analysis & Forecasting online publication.


Post Comment

Only logged in users are allowed to post comments. Register/ Log in