Has The Gold Price Drop Run Its Course?
Commodities / Gold and Silver 2014 Sep 23, 2014 - 06:31 PM GMTBy: GoldSilverWorlds
 The gold price dropped in the last weeks, to close on Monday September 22nd at USD 1212 and EUR 942. Dollar gold is close to retest its bottom for the third time since mid-2013, a price level which was seen only in the summer of 2010. For readers seeking to understand what is going on, we are providing a comprehensive view on the gold market. We take all perspectives into account: price and chart patterns, the technical picture, sentiment, the fuures market, physical demand, gold miners, the influence of the dollar, correlation with commodities, monetary policy and inflation/deflation.
With 20 different charts, it should be clear that we have only used market data in our analysis. In other words, this article contains the necessary information for readers to put the current gold price decline in its right context and explain the most likely scenarios going forward.
Gold price pattern
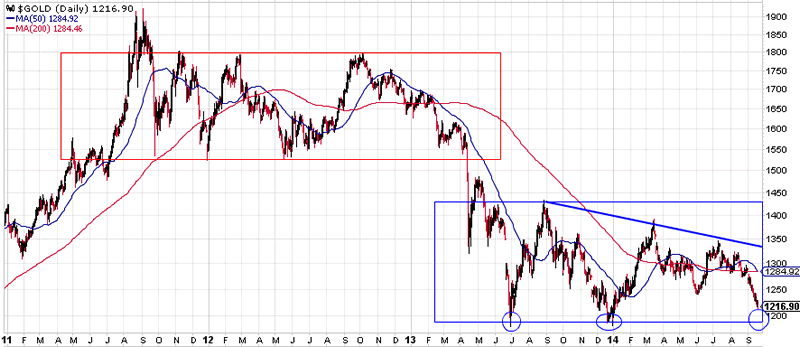
The daily USD gold chart clearly shows a downtrend since its top in September 2011, with two large trading ranges. The current trading range, between USD 1180 and 1450, is about to undergo a serious test as its bottom is being tested for the third time (mostly a decisive event). In case the USD 1200 to 1180 price level does not hold, the gold market is heading (significantly) lower.
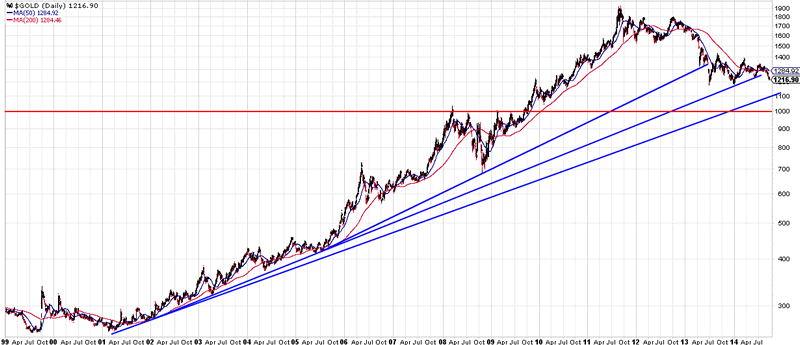
In case the gold price would trade in a lower trading range than the current one, would it mean that the bull market is over? The answer to that question primarily lies in the gold price chart of a larger timeframe. As the following chart shows, there are three long term trend uptrend lines at play, which primarily found their origin in the period between 2001 and 2004. The first of the three lines provides support at USD 1100. The price point at USD 1000 provides major support as it coincides with a local top in 2008 which was retested several times in 2009. It implies that USD 1000 – 1100 is a major support area within the secular bull market. It goes without saying that, if that area would be violated, precious metals are in serious trouble. The price peak of 1980 would be, from a chart perspective, some sort of last hope for gold bulls.
Technical picture
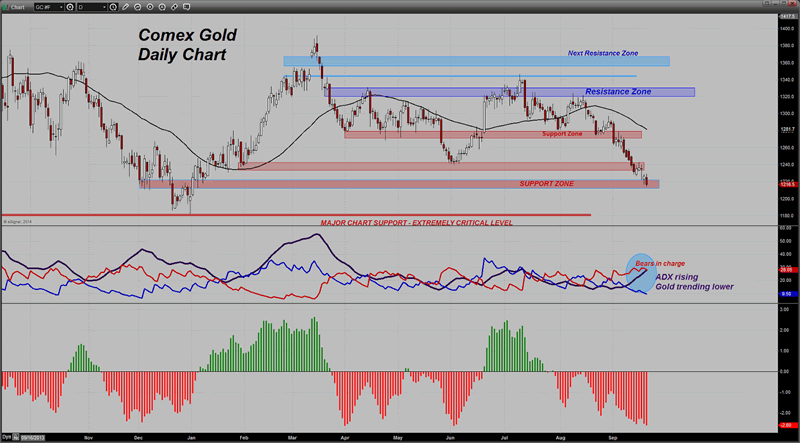
From a technical point of view, it is quite obvious that the selling pressure is not over. Dan Norcini, professional trader for more than two decades, uses the average directional index (ADX) as a measure of a trend’s strength. The rising red ADX line and declining blue line point to a clear and strong trend. Norcini sees little in the way of further support until gold gets back down to the former double bottom low near $1180. From his personal blog: “I suspect that will not hold if the Dollar index runs past 85.50. If gold does manage to get down to near $1200, Asian buying will no doubt be active but it will be insufficient to sustain the metal if Western interests become aggressive sellers. Along that line I am closing watching reported GLD holdings and to some extent, the action in the gold mining shares, which incidentally, look very heavy at the moment.” We will come back to the Dollar and the physical market later on.
As evidenced on the next chart, gold’s move down to $1210/12 coincides with a couple of Fibonacci extension levels, based on gold’s rally from December 27th till the end of February of this year. Gold’s momentum indicator shows a significantly oversold reading. However, “oversold” is not a valid timing indicator, as an asset can remain oversold for several days or weeks. It also does not help in determining support levels in terms of prices.
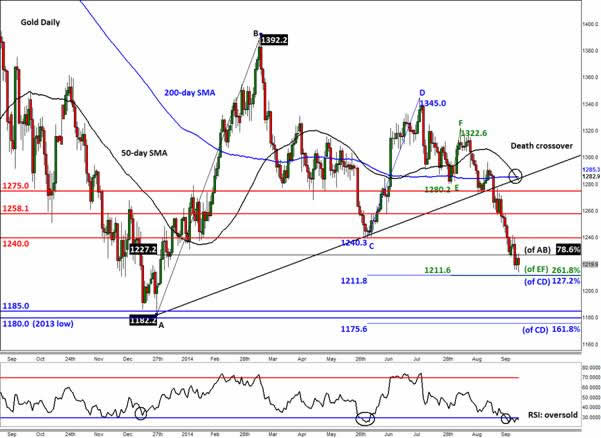
The bearish outlook would be invalidated with a closing break above USD 1240, the 78% Fibonacci level, according to Matthew Weller.
Sentiment readings
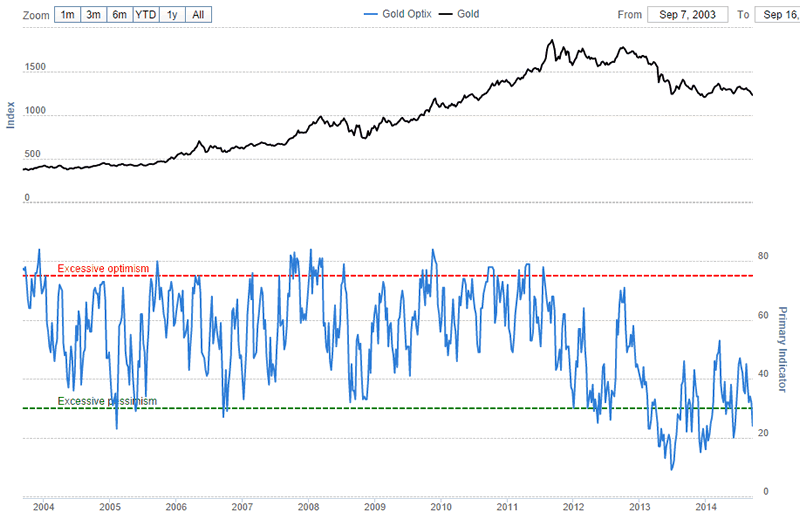
According to Sentimentrader‘s analysis, gold has a reading of 20 on a scale to 100. Silver’s sentiment stands at 30. That is low, but not as extreme as it possibly can get. Compare these readings with the bottoms of the last 18 months:
- sentiment on April 17th 2013: gold 10, silver 0
- sentiment on July 5th 2013: gold 10, silver 0
- sentiment on December 31st 2013: gold 10, silver 10
What we are trying to say is that pessimism could become worse than it is today. The gold sentiment over the last ten years which is shown light blue line on the following chart makes that point.
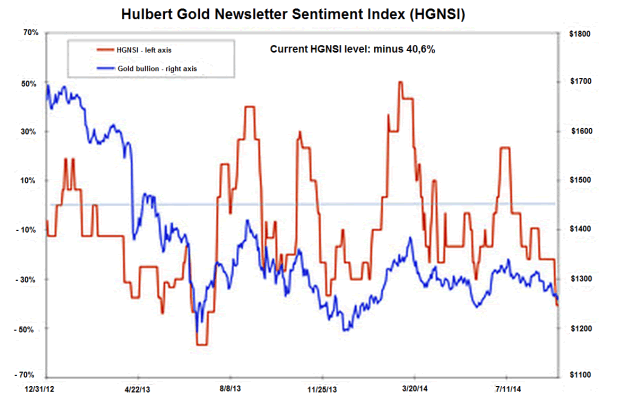
Similarly, the newsletter sentiment index by Hulbert which measures gold sentiment shows comparable pessimism. The red line shows that sentiment reading stands at minus 40.6%, which means that the typical gold timer is recommending that clients allocate nearly half their gold-oriented portfolios to going short the market. Marketwatch notes: “That’s a particularly aggressive bet that gold will keep declining, and — at least according to contrarian analysis — these timers are unlikely to be right. As recently as last week, the HGNSI had not fallen below minus 21.9%. That was less than the lows to which this sentiment index fell last December (minus 36.7%) and in the summer of 2013 (minus 56.7%). And that, in turn, led me to conclude that contrarians were not yet ready to bet on even a short-term rally.”
Physical gold market
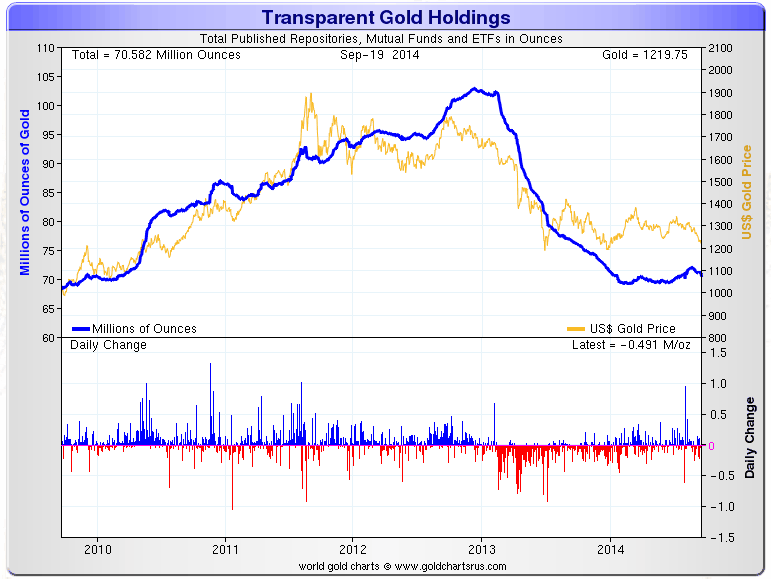
The demand for physical gold is not the root cause for the drop in the gold price. We like to use the total physical gold holdings of the major gold ETF’s in the West as a proxy for the Western physical gold market. As the chart below shows, the total holdings are rather stable in 2014, even slightly increasing in Q2 of this year. So this is clearly not a catalyst for a gold price decline. Note that the GLD ETF is making up almost 40% of the holdings on the chart. Courtesy of Sharelynx.
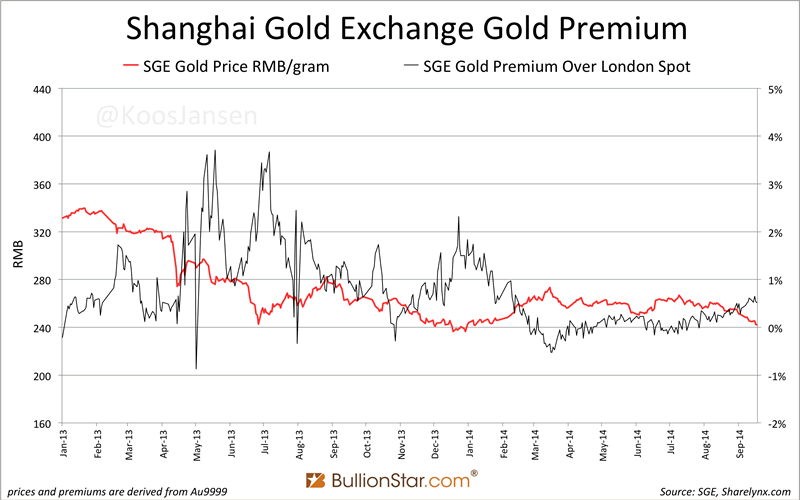
Similar to the gold price drop of last year, the recent decline has attracted an increased number of buyers in Asia. Koos Jansen, analyst of the physical gold market in China, wrote this week: “The SGE 1 Kg Au9999 physical contract closed at 0.52 % above London spot; premiums are in an uptrend since July. This underlines strong demand for gold in China, in contrast to what western media report based on gold export from Hong Kong to the mainland, data that has lost its significance as China imports more gold directly, bypassing Hong Kong, since April.”
In India, the former biggest consumer of physical gold in the world, gold demand is expected to pick up as the wedding season starts. Reuters reported that “gold demand is improving gradually and is expected to rise further in the coming months ahead of Diwali,” according to a Mumbai-based jeweller. “Sales during the first six months were weak but now it is likely to pick up,” he said. Meantime, according to Goldcore on Zerohedge, trade statistics for the month of August have shown a huge surge in gold imports compared to August of 2013. The value of gold officially imported into India in August totalled $2.04 billion, which was nearly three times more than the August 2013 figure of $739 million.
The conclusion is that the ongoing gold transfer from the West to the East continues. Also, the West is not dumping its physical gold to the extent that it causes prices to decline.
An equally important segment of the physical market is the wholesale gold market (think kilobars gold). As Bron Suchecki notes, premiums have come up off the floor and are moving up nicely. It caused Suchecki to have a look at the kilobar movements in COMEX warehouses which he documented in the chart below.
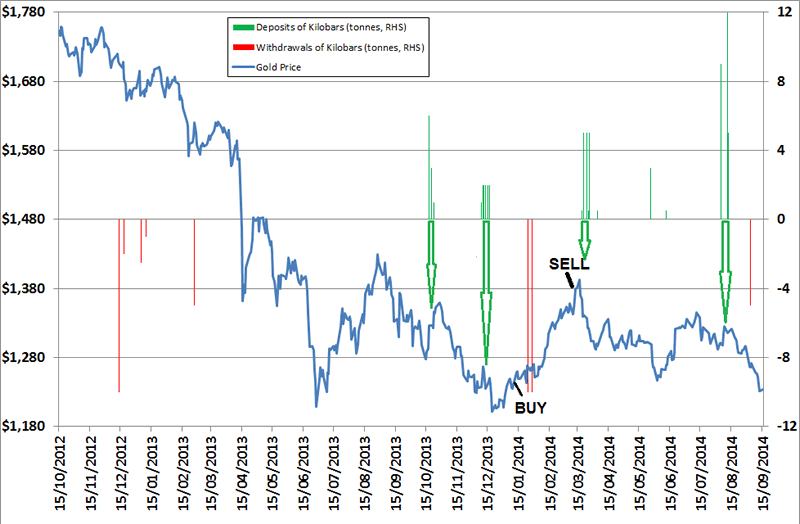
What the charts shows is “that deposits seem to line up with future price weakness, as bullion banks stockpile them when Asian demand is weak. The withdrawals of kilobars, certainly in January this year, foretold price strength but it is not as strong an indicator considering the late 2012/early 2013 ones. You can see that on the 2nd of September 5 tonnes came out of JP Morgan’s warehouse and that doesn’t surprise me considering the renewed interest we are seeing. Worth keeping an eye on the COMEX movements to see if more of the 26 tonnes that was deposited in August is pulled out.”
COMEX gold futures market structure
Without any doubt, the most important driver of the gold price is the gold futures market at the COMEX. The volumes traded every day, calculated in ounces of gold, are huge compared to the real world of demand and supply. The latest COT report figures are displayed below, courtesy of GoldSeek.
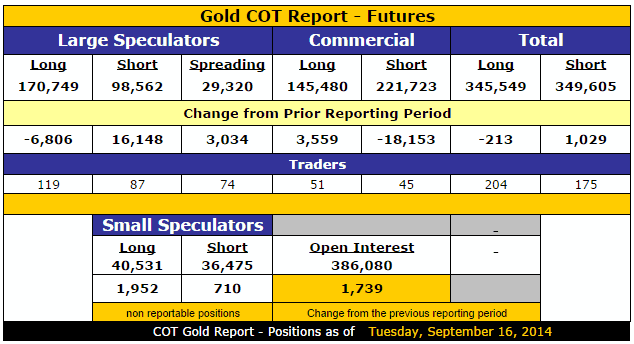
Ted Butler is the analyst who has brought the manipulation in the COMEX futures market to the surface. He is a student of the gold and silver futures markets for 4 decades. In his latest market commentary on www.butlerresearch.com, Butler explains that “the total commercial net short position has declined by 21,700 contracts, to 76,200 contracts, the lowest (most bullish) level since June 10 (when gold began a $100 rally). All three commercial categories participated in the $35 orchestrated decline in the price of gold … Somewhat surprisingly, JPMorgan stood pat with 25,000 contracts net long.
Interestingly, the concentrated short position of the 4 and 8 largest COMEX gold shorts is now lower than any time since May 2013 and may now be lower (since the cut-off) than any point in years. In time, good things always seem to happen to the price of gold when the largest COMEX commercial shorts hold record low short positions.”
The technical funds hold more than 73,000 contracts in gross shorts, which coincides with the June extremes. After the sharp gold price decline of the last days, technical fund shorts in gold now may exceed the all-time managed money extreme short position of almost 83,000 contracts on Dec 24, 2013. On the short turn, new lows in gold are still possible if the technical funds continue to pile on new shorts; but these positions are considered as fundamentally bullish for the medium term by Ted Butler.
Butler concludes: “A perfect COT set up must be defined as being comprised of the least amount of commercial shorts and the maximum amount of technical fund shorts. Unfortunately but realistically, it would be impossible to achieve such a perfect COT set up on anything other than a pronounced and persistent sell-off of the kind we’ve just experienced. There is simply no way for the commercials to reduce their overall net short position or for the technical funds to increase their gross short position on anything other than successively lower prices.”
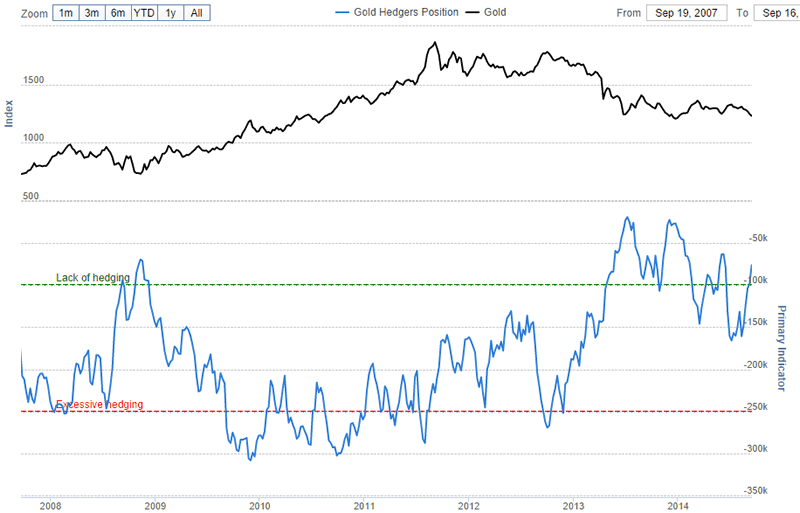
Another expert of the gold futures market, Dan Norcini, points out that the hedge fund community (see “large speculators” in the COT report above) is still net long, even with the current price drop. It implies that there is still some room left to cut long positions, resulting in a continuation of declining prices. The key question for Norcini is what is the hedge funds’ threshold for tolerance of pain is. “Some will hold on until or unless $1180 is broken. Some will exit if psychological support near $1200 collapses and gold then changes handles once more from “12” to “11”.” The light blue line on the chart shows that hedge funds have been shorting more heavily on similar low prices in the last 18 months.
Gold in other currencies
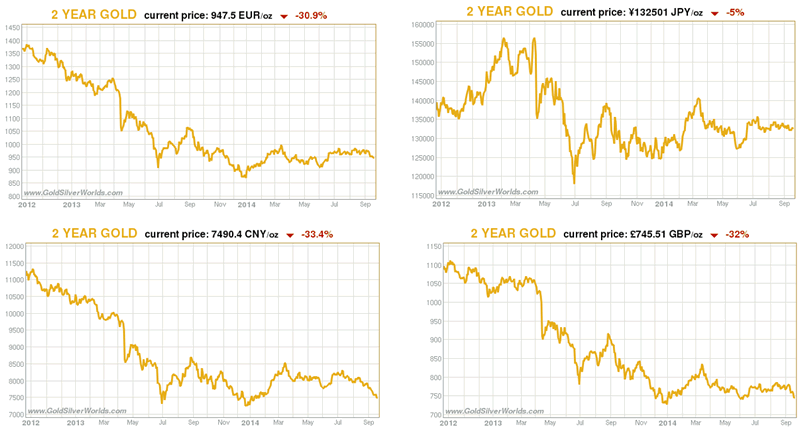
Another way to look at the gold price is the strength or weakness in various currencies. Dollar gold is testing for the third time the lows of its 18-months old trading range. Gold in Brititsh Pounds and in Chinese Yuan is showing a similar picture. However, Euro gold and Yen gold are relatively better off, as evidenced by the first two charts in the collection below. This is not a huge strength, but it is a positive aspect in the overall picture.
Gold miners
As a general rule of thumb, the gold miners are leading the yellow metal higher or lower. When miners are accelerating in the same direction as the metal, it is proof of a strong trend. Up until Thursday September 18th, the miners were holding up remarkably well. Unfortunately, in the last two trading sessions they have accelerated their downward move. This is not a sign of (short term) strength for the metals.
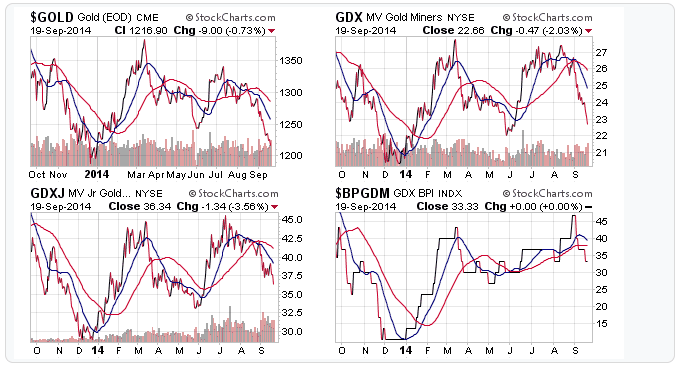
On a more positive note, the chart at the bottom right shows the Gold Miner’s Bullish Percentage Index. Although the miners are heading south in the last two days, the Gold Miner’s Bullish Percentage Index has not broken down. Also, the GDX and GDXJ indexes are still above their lowest point of the year (first days of 2014). One should pay close attention to the evolution of these indexes.
Intermarket analysis: commodities
It is not only the metals trading at long term support, at the bottom of a long term trading range. The commodities index is also under severe pressure; it is standing at a point where it could break down. The following chart, courtesy of Dan Norcini, makes clear how commodities have been trending down since their peak in 2011.
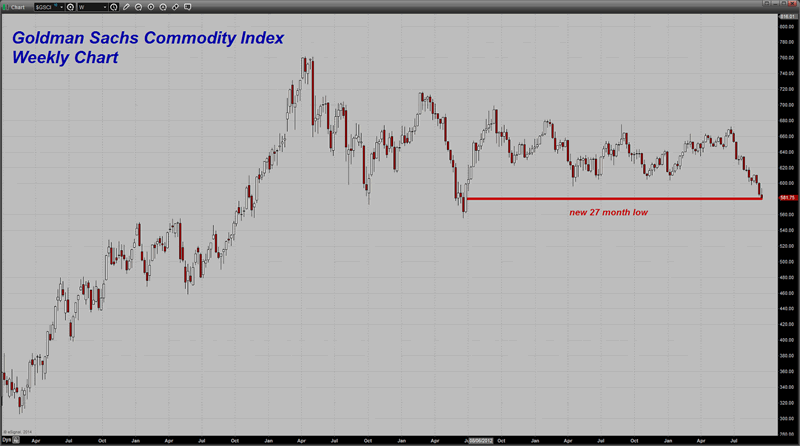
Metals and commodities are highly correlated, for sure in the last years. Their price pattern is comparable. Clearly, deflationary pressure is present in the economy. Is the commodities index about to break down and are we about to experience a deflationary collapse? Or will inflation pick up from here? The jury is out, and we have to monitor the market data very closely. Whichever direction it goes, the consequences can be significant.
Dan Norcini sees this environment with low inflation and slow economic growth. In such market conditions, traders and investors have a preference for stocks; gold is expected to fall out of favor even further, and commodities are expected to move lower.
US Dollar strength and monetary policy
Undoubtedly, the main catalyst of recent weakness in commodities and metals is US Dollar strength.
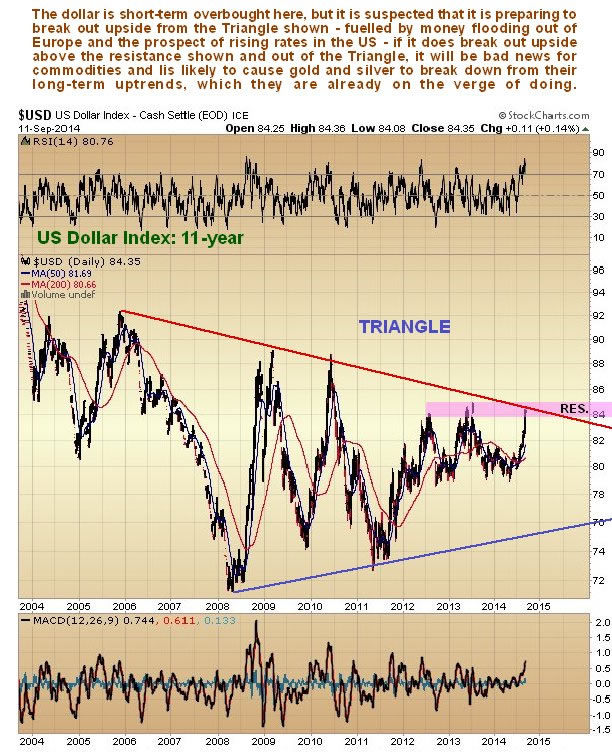
The US Fed is expected to end its QE program (monetary stimulus) still in 2014, resulting in a slower pace of growth of liquidity. At the same time, China and Europe are launching their version of QE. As Frank Holmes from USFunds.com notes, low inflation comes with the risk of dipping into deflation territory, which China is now facing. The country’s own PPI declined 1.2 percent in August, continuing a 30-month downtrend, while its CPI rose only 0.2 percent from July. To counteract this slowdown, China’s central bank injected $81 billion to five state-owned banks. So far the market seems to have liked the stimulus measure. Like the People’s Bank of China, many central banks around the world continue or are implementing easing policies. The European Central Bank (ECB), for instance, will be buying close to $1.3 trillion in bonds to provide fresh capital to the Union’s depressed banking system. All of this global stimulation activity is good for global financial markets and specifically U.S. equities.
Economic picture: Inflation vs deflation
In our opinion, a key driver of the precious metals complex is related to inflation vs deflation expectation. It is no coincidence that gold and silver peaked in 1980 and 2011, right at the time when inflation expectations were at historically high levels.
Today’s world has become more complex than ever. Jim Rickards believes it is a mistake to get into a binary world where you have inflation and then you have deflation. “I think we have both at the same time. We have inflation and deflation at the same time. Deflation is natural because of the depression. Inflation is induced because of policy. It is absolutely the case that central banks cannot allow deflation. They must cause inflation. They are going to keep printing or keep easing or whatever it takes to defeat this deflationary monster. I think we are on an inflationary track but it might not come so quickly. It might take another year or so to really take off. (source: Incrementum’s Advisory Board on GoldSilverWorlds)
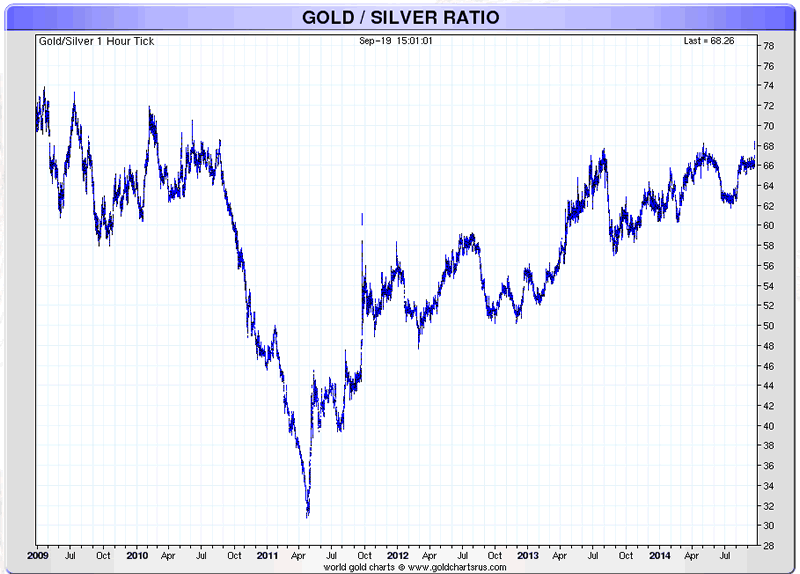
This view is confirmed by the gold/silver ratio. Ronald Stoeferle wrote in his latest In Gold We Trust report: “An excellent indicator for the interaction between inflation and deflation is the gold/silver ratio. Gold benefits not only from rising inflation rates but also from deflationary episodes. One could therefore also refer to the gold-silver ratio as the “deflation/reflation” ratio. According to our statistical evaluations, the probability of a sustainable gold price rally is significantly diminished when the gold/silver ratio is rising.”
At a time when debt keeps on expanding, the price of gold is getting disconnected from its historical correlation with debt. Most likely, the underlying cause is major distortion in the markets caused by excessive central bank interventions.
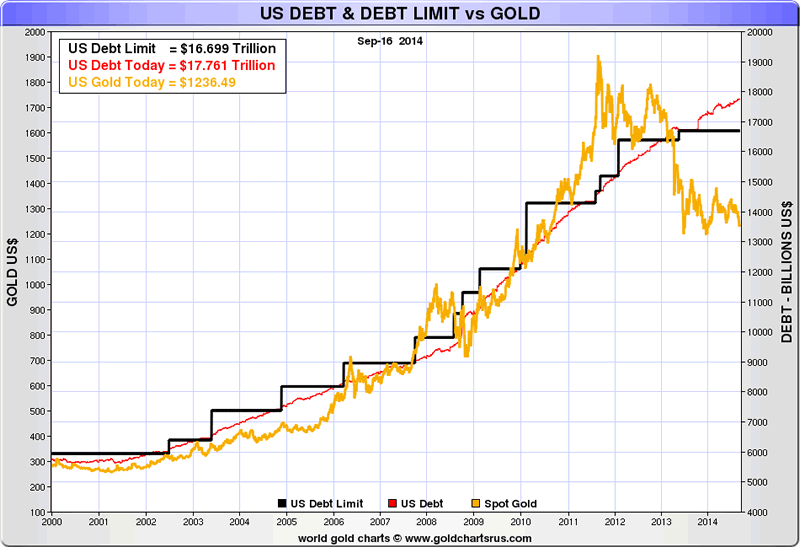
What does the disinflationary force, combined with a fight of central banks to create inflation, imply for your portfolio? The point is that one can reasonably expect that central planners will achieve their inflation target. So, one has to make make both bets, meaning that you should hold some inflationary bets and some deflationary bets at the same time. That is why gold in physical format still deserves a position in a balanced portfolio.
Conclusion
This article provides an analysis of each (potential) driver of the gold price. It is clear that recent price weakness is not caused by the physical market. A rising US Dollar, coinciding with the end of QE and an expectation of rising rates is putting serious pressure on Dollar gold. However, gold in Euro or Yen is keeping up relatively well.
Sentiment and technicals are getting extreme, but history shows that there is room for even more extreme conditions. It suggests that selling pressure is not over yet; one can reasonably expect lower prices. The COMEX futures market structure in gold is becoming bullish, but here again, there is room for more downside in the short run.
So, to answer the key question in the title of this article: no, it is not likely that the gold price drop has run its course. Lower prices are in the cards. Even with declining prices, the secular gold bull market will still be intact with a gold price in the range of USD 1000 – 1100.
One final note: were gold prices to rebound from here, in other words would the third retest of the current trading range, it would suggest the final bottom would be in. The key price level to watch is USD 1180.
A key driver to closely monitor is the US Dollar index. The key price level to watch is 85; once that level is broken to the upside, one can reasonably expect lower metals prices. If that were to happen, it could result in capitulation in the precious metals complex. No matter how painful that would be for gold bulls, it could result in a “wash out bottom” which could mark the continuation of the secular bull market.
On the other hand, shorter term, the US Dollar is getting overbought, so at least a relief rally is in the cards. Longer term, it remains doubtful whether a strong US Dollar is what the US economy needs. In a global currency war, a strong currency is not a blessing.
With central planners keen to devalue their currency by monetary easing, one could reasonably expect monetary policy to continue to play a key role for the metals. With a fundamental fear for deflation, central bankers will do “whatever it takes” to create inflation. That is, longer term, undoubtedly a key driver for the metals.
As for individual investors, our view is that, even if gold prices were to drop further, it is not a time to sell physical holdings. By contrast, investors should “welcome” lower prices, for sure if sentiment and technicals become extremely negative, as longer term it remains most likely that gold will shine again.
Source - http://goldsilverworlds.com/price/has-the-gold-price-drop-ran-its-course/
© 2014 Copyright goldsilverworlds - All Rights Reserved Disclaimer: The above is a matter of opinion provided for general information purposes only and is not intended as investment advice. Information and analysis above are derived from sources and utilising methods believed to be reliable, but we cannot accept responsibility for any losses you may incur as a result of this analysis. Individuals should consult with their personal financial advisors.
© 2005-2022 http://www.MarketOracle.co.uk - The Market Oracle is a FREE Daily Financial Markets Analysis & Forecasting online publication.


