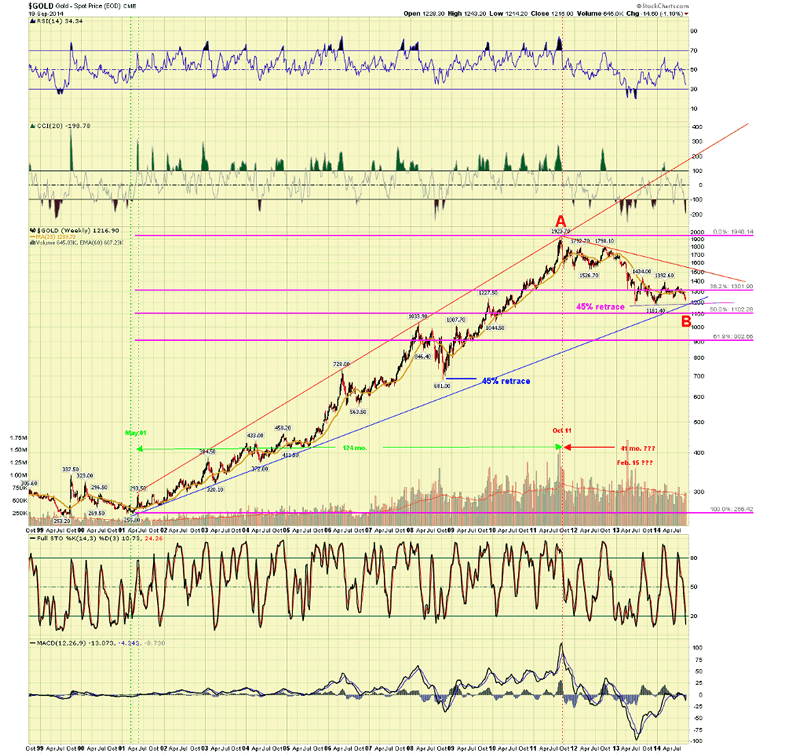
Long Term Gold Price Chart with Retracements
Commodities / Gold and Silver 2014 Sep 21, 2014 - 10:26 AM GMTBy: Jesse
Our friend Lenny sent the patrons of the café a long term gold chart that is quite interesting We have certainly been through the ups and downs of these markets together,
It shows the strong support at 1180, and the longer term trend line that works on a logarithmic chart.
I asked Len to include the retracement levels, because as I recalled there had been a prior big retracement earlier in this bull market, from 1030 to 681 that shook quite a few people out.
I was wondering how this current price decline compared.
Here is the chart. We can draw lines on charts all day. It is the action in the market, the push of supply against the pull of demand, that will set the true marks. But these days it seems we can only count on price discovery in the intermediate term.

By Jesse
http://jessescrossroadscafe.blogspot.com
Welcome to Jesse's Café Américain - These are personal observations about the economy and the markets. In plewis
roviding information, we hope this allows you to make your own decisions in an informed manner, even if it is from learning by our mistakes, which are many.
© 2014 Copyright Jesse's Café Américain - All Rights Reserved
Disclaimer: The above is a matter of opinion provided for general information purposes only and is not intended as investment advice. Information and analysis above are derived from sources and utilising methods believed to be reliable, but we cannot accept responsibility for any losses you may incur as a result of this analysis. Individuals should consult with their personal financial advisors.
Jesse Archive |
© 2005-2022 http://www.MarketOracle.co.uk - The Market Oracle is a FREE Daily Financial Markets Analysis & Forecasting online publication.


