


Russell 2000 Stock Index Analysis
Stock-Markets / Stock Markets 2014 Sep 19, 2014 - 08:32 AM GMTBy: Austin_Galt

 Let's analyse the Russell 200 Index which consists of 2000 small cap stocks. We'll begin with the big picture - the yearly chart.
Yearly Chart
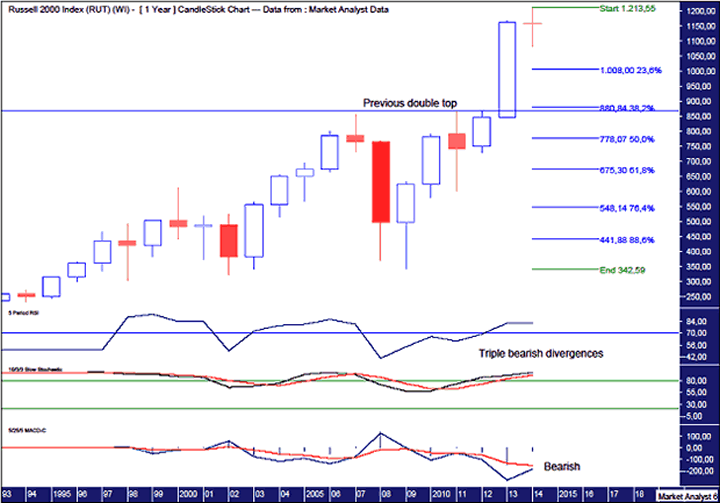
I have a drawn a horizontal line across the 2007 and 2011 tops. This was a double tops. Double tops generally don't end trends so it was no surprise to this busted shortly thereafter. That brings us to the present.
We can see if the year were to end right now, the 2014 candle would be a marginal red doji. But there are still a few months left in the year. It would be interesting if price were to rise and then fall back to the same level and so finish with a similar candle.
I have added a Relative Strength Indicator (RSI) and Stochastic indicator which are all showing weaker readings at each new high. If price were to top this year or next then it would be accompanied by triple bearish divergence in both indicators. And this is the yearly chart. Something to think about.
I have added Fibonacci retracement levels of the move up from the 2009 low to recent high. Keep in mind that the high may not be in but I only expect marginally higher which should not overly affect this analysis. I would think a move to the 50% level at the minimum would be needed to end any yearly down trend. Especially considering the existence of triple bearish divergences.
Monthly Chart
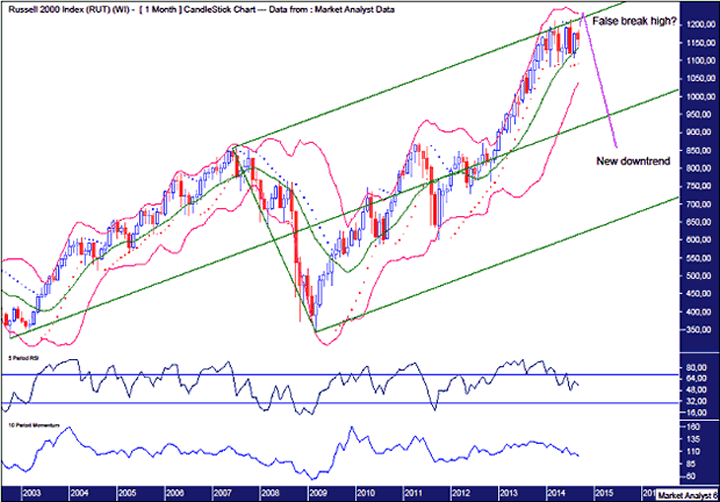
The RSI has been weakening all year. Perhaps one last high would throw up a bearish divergence.
The Momentum indicator shows this market is losing momentum.
I have added an Andrew's Pitchfork and we can see price has been nudging the top trend line for most of this year. Perhaps one last fake out above this upper trend line will finish off the uptrend.
The Bollinger Bands show price moving away from the upper band at the start of the year and seemingly finding support at the middle band. Perhaps one last hurrah at the upper band is required. Interestingly, the upper band is just above the upper pitchfork trend line so that would kill two birds with one stone.
The pattern of trading in 2014 looks like a big consolidation. I'd like to see one last pop into top before a drop. A marginal false break high would look good.
Weekly Chart
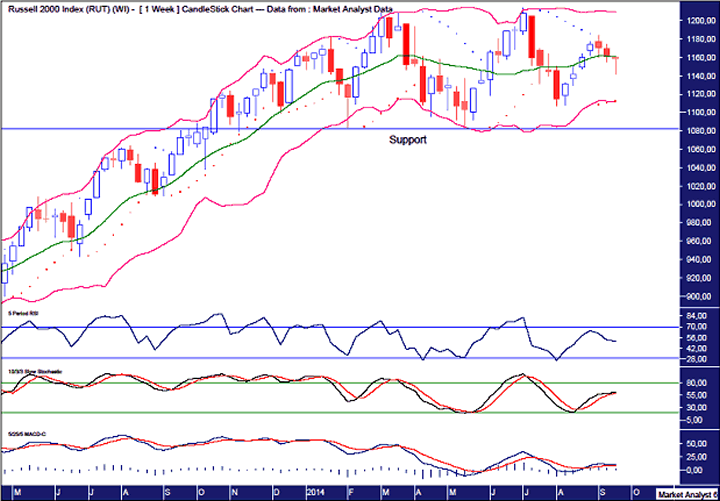
This chart looks fairly simple but there is a key characteristic that stands out to me. That is the existence of a double top. Now this double top is against the trend so it really should not be the end of the trend. Of course there are always exceptions.
I have drawn a horizontal line along the lows in February and May this year. This was a double bottom which should lead to new highs. Breaking this support will be bearish whenever that happens.
The RSI is currently in no man's land but perhaps a marginal new high would be accompanied by a bearish divergence with the RSI reading lower than the previous high. Let's see.
The Stochastic indicator is trending up and looks to be going in for a kiss now. This is common at halfway points in a trend. I favour this continuing up.
The MACD is currently negative but that would most likely change with a move to new highs. And perhaps a new high would also be accompanied by a bearish divergence.
In concluding, things are looking stretched here but there is still room to go higher. That may well occur over the next month or so. One to keep an eye on.
By Austin Galt
Austin Galt is The Voodoo Analyst. I have studied charts for over 20 years and am currently a private trader. Several years ago I worked as a licensed advisor with a well known Australian stock broker. While there was an abundance of fundamental analysts, there seemed to be a dearth of technical analysts. My aim here is to provide my view of technical analysis that is both intriguing and misunderstood by many. I like to refer to it as the black magic of stock market analysis.
© 2014 Copyright The Voodoo Analyst - All Rights Reserved
Disclaimer: The above is a matter of opinion provided for general information purposes only and is not intended as investment advice. Information and analysis above are derived from sources and utilising methods believed to be reliable, but we cannot accept responsibility for any losses you may incur as a result of this analysis. Individuals should consult with their personal financial advisors.
© 2005-2022 http://www.MarketOracle.co.uk - The Market Oracle is a FREE Daily Financial Markets Analysis & Forecasting online publication.