Gold Price Hammered by Strong U.S. Dollar
Commodities / Gold and Silver 2014 Sep 18, 2014 - 03:06 PM GMTBy: Clive_Maund
 The Pope just observed that the situation in the world today amounts to a Third World War - he's right and although he didn't point the finger, we know what it's all about - the maintenance and imposition of the dollar as the dominant world currency, by diplomacy or by force as deemed necessary. We will come to these geopolitical considerations later as they of course have huge implications for the dollar and thus for Precious Metals.
As you probably know we had expected gold and silver to start picking up in the last update, for various reasons, the most important of which was that they are at important support at the most bullish time of year, seasonally, for the Precious Metals, but the dollar rally accelerated even more, driving gold and silver still lower and deeper into key support which is now being severely tested. If the dollar continues higher then gold and silver could crash key support, but this doesn't look likely short-term because the dollar is now critically overbought and needs to take a breather.
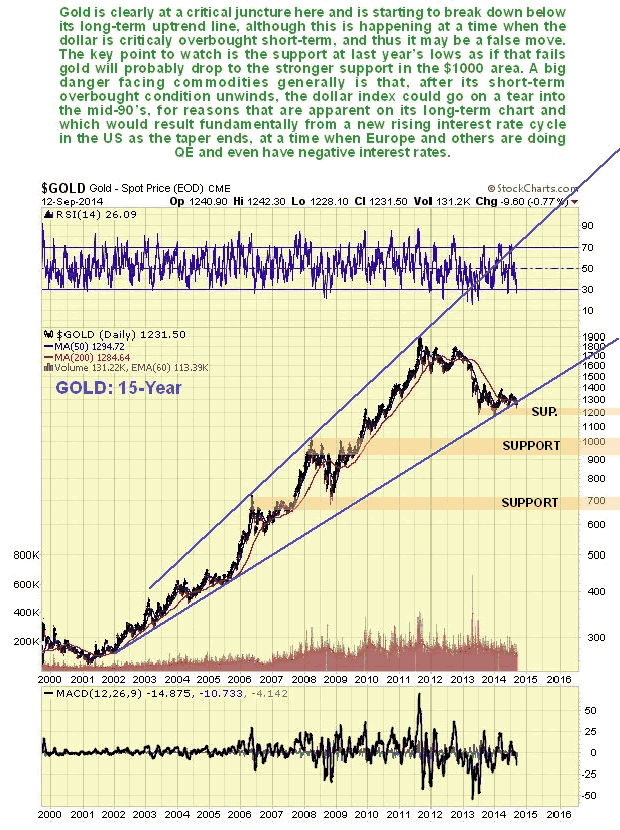
On its 15-year chart we can see how gold is just starting to break down from its long-term uptrend in force from late 2001, although thus far the break is marginal, and with the dollar so overbought it looks likely that it will step back from the brink. However, with another big dollar upleg looking likely after its overbought condition has unwound, the threat of eventual failure of this support may not go away soon. The key point to watch is the support at last year's lows, which is not far beneath the trendline, but we should also note that Big Money may force a brief move below this support to trigger stops and run investors out of their positions before a sudden reversal.
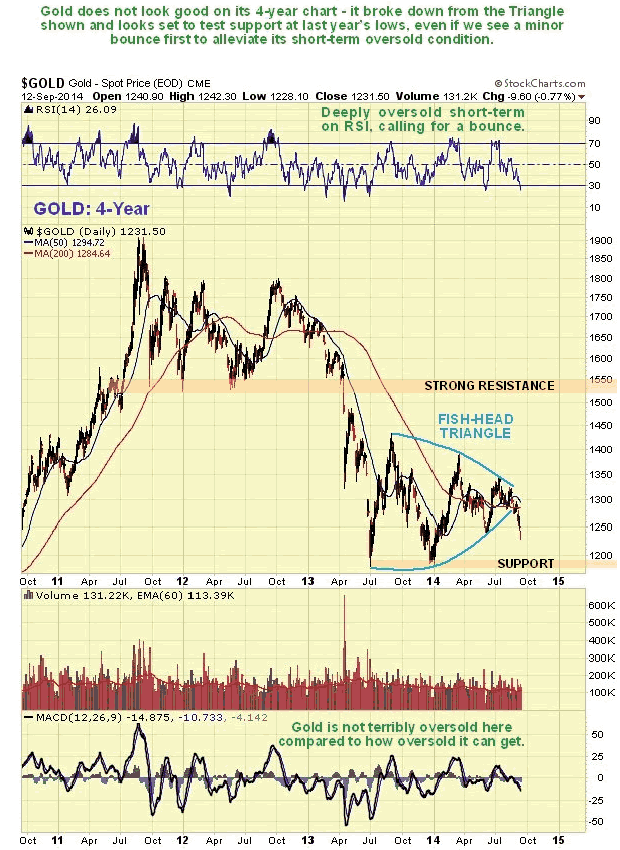
On its 4-year chart we can see that gold has broken down from its Triangle pattern that had formed for over a year, which has made a test of last year's lows likely soon, perhaps after a short-term bounce as the dollar digests its recent gains.
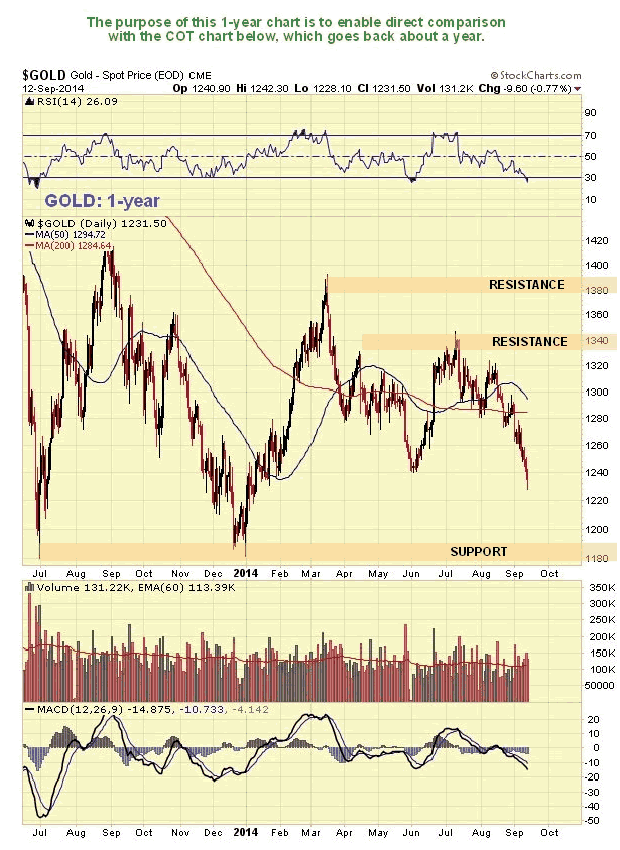
On its 15-month chart we can see that gold could "freefall" from here to support at year's lows, if the dollar doesn't consolidate short-term as we are expecting. If it does, gold could bounce back perhaps to the $1260 area. Note that gold is already critically oversold on its RSI, although that won't necessarily prevent a plunge from this position.
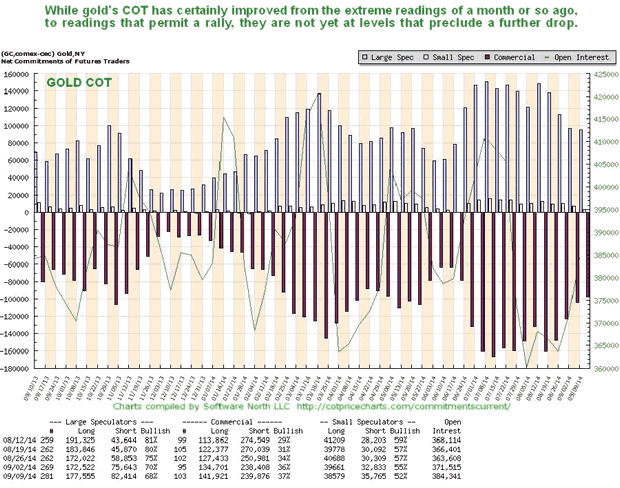
Gold's COT readings have eased substantially in recent weeks, but as we can see on the latest COT chart, there is room for more improvement, meaning that the improvement thus far is not enough to prevent further losses.
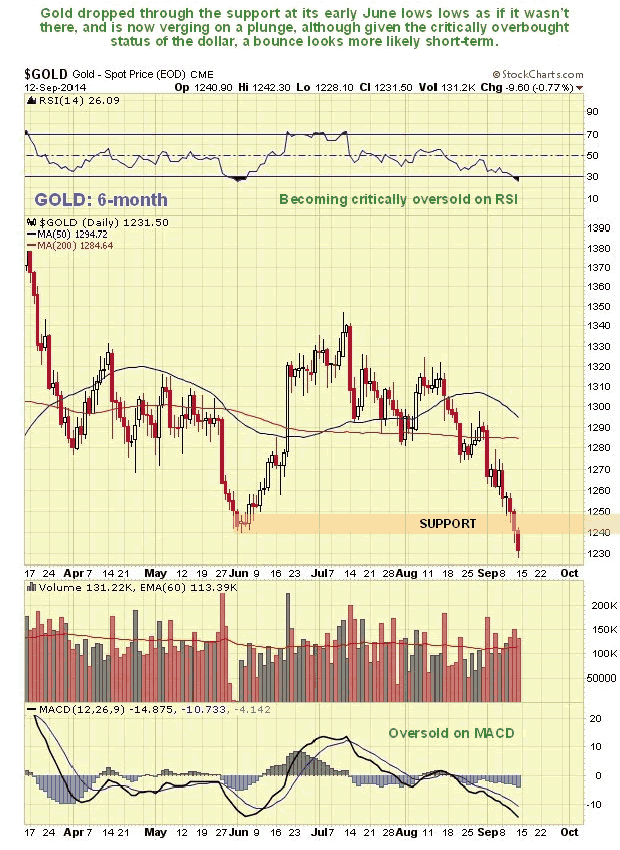
On the 6-month chart gold's losses are starting to look a bit climactic, and it is substantially oversold. So this is a good time for it to stage a relief rally as the dollar consolidates recent gains.
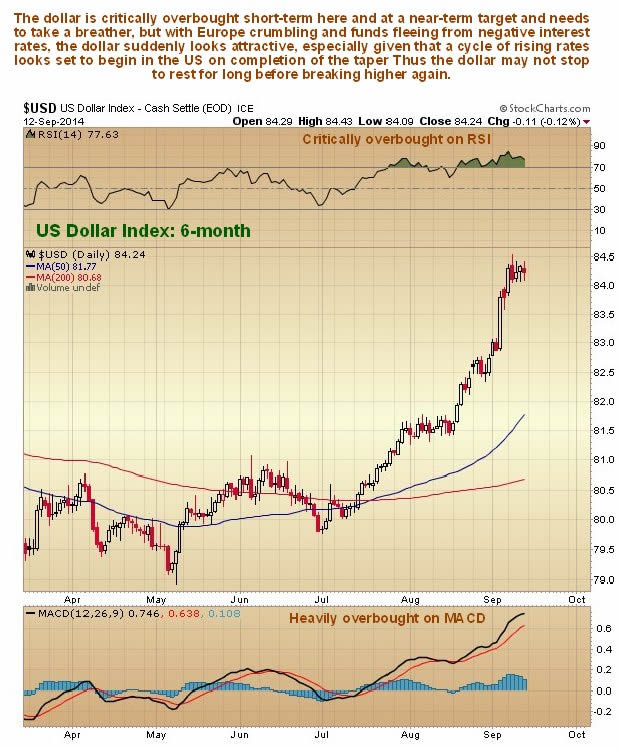
Now we come to the principal determinant of the gold price, and the big and obvious reason for its recent losses - the dollar. On the 6-month chart we can see how the dollar index has accelerated over the past week or two so that it is now critically overbought on a short-term basis, which is why we are expecting it to consolidate for a while soon. It is thought unlikely that it will react back much, if at all, however, and after consolidation and perhaps a minor reaction, the risk is that it will go on a tear into the mid-90s. Let's now look at the long-term chart to see technically why this should be.
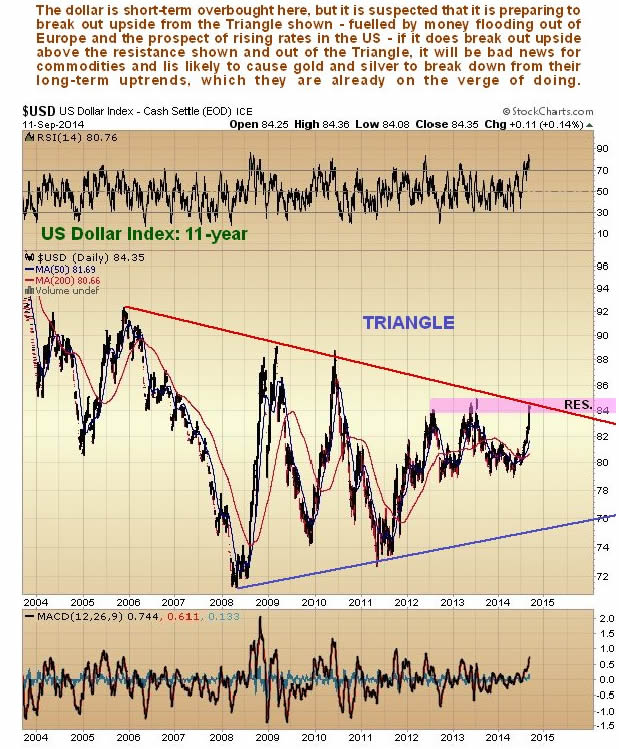
On its long-term 11-year chart we can see that it's not just gold and silver that are at a critical juncture, the dollar is too, because it is on the point of breaking out upside from the huge Triangle shown, and fundamentally, as we will see, there are very good reasons for it to do so soon. However, it doesn't look like it will happen right away because it is so overbought on a short-term basis, as we have already seen, but after due consolidation of recent gains, another upleg appears to be on the cards, and it could be really big.
So what's going on? - what's the Big Picture? - how does it all fit together - the crisis with Russia and the Ukraine, the increasing chaos in the Mid-East and elsewhere? - and why is the dollar gathering strength as it is?
The Pope sees what's going on but he can't go pointing fingers - otherwise he will have to get the bullet proof glass reinstated on his Popemobile. What we are witnessing now is nothing less than the New World Order (NWO) endgame - the completion of the drive for world domination. Whilst this conjecture may be classed as "conspiracy theory", remember it's in order to be a conspiracy theorist when there actually is a conspiracy. Although obviously largely based in the US and more specifically Washington, the NWO are actually a supra-national elite whose "power centers" include, in addition to the US, the UK and Israel. They live international lives, which has definite tax advantages, and probably regard with amusement the parochial nationalism of most people which they routinely exploit. The UK is an interesting case because it never joined the single currency and one of its roles is to "throw a spanner in the works" and derail various EU initiatives. The elites obviously don't want Scotland becoming independent as it goes against their global drive for centralization and are right now engaged in a vigorous anti-independence propaganda campaign in the major media outlets under their control against the "Yes" vote that in addition to blatant scaremongering involves attempting to smear Alex Salmond, the leader of the Scottish Nationalists.
The two main planks of the NWO drive for world domination are economic subservience achieved through imposing the dollar as the global reserve currency, involving such things as the SWIFT payments system, which entire countries can be shut out of at their discretion, and a massive overpowering military machine, which is used to impose their will by force, where diplomacy and coercion fail to produce the desired results. We have already seen 3 countries destroyed who dared to stand in their way - Iraq and Libya were planning to sell their oil in currencies other than the dollar, and Syria is an ally of Russia, and therefore came under attack as a way of getting at Russia. They haven't (yet) succeeded in overpowering Syria, but Assad's resistance has left the country in ruins, and they will probably soon "go in and get him" under the guise of chasing down ISIS (or ISIL).
Russia has made a lot of bilateral trade agreements with China over the past year or two which bypass the dollar. This cannot be tolerated, which is why the coup was fomented in the Ukraine as a means of sucking Russia into confrontation which was then used as an excuse for robust anti-Russian propaganda as a prelude to heavy sanctions, which are intended to either force Russia to kneel, or destroy it economically. They can't attack Russia directly because it has a formidable array of nukes, otherwise they would, so for now they have to confine themselves to racking up the pressure on Russia and seeing if that does the job. If they succeed in facing down and subjugating Russia, they will continue to complete the job by going after the largest and juiciest fruit on the tree - China. China has already figured this out, which is why it is embracing Russia and supporting it, and scrambling to develop a credible military deterrent before it has to square up to the US military, which is of course the underlying reason for their space program. China and Russia are the "King and Queen" of the BRICS trade pact. BRICS stands for Brazil, Russia, India, China and South Africa. Brazil and South Africa are just pawns in the eyes of the NWO, as they can be easily overcome. India is bigger and more difficult - it has a huge population but is comparatively weak and unsophisticated, and can probably be manipulated or coerced into compliance - the judicious application of bribes at the highest levels might be all that is required to get it to "see the light". The overall objective is to destroy the BRICS pact, and the threat it involves to global dollar dominance. Encouraging Japan to militarize is another way of racking up the threat against China and has the added interim advantage of potentially producing big lucrative contracts for US defense manufacturers.
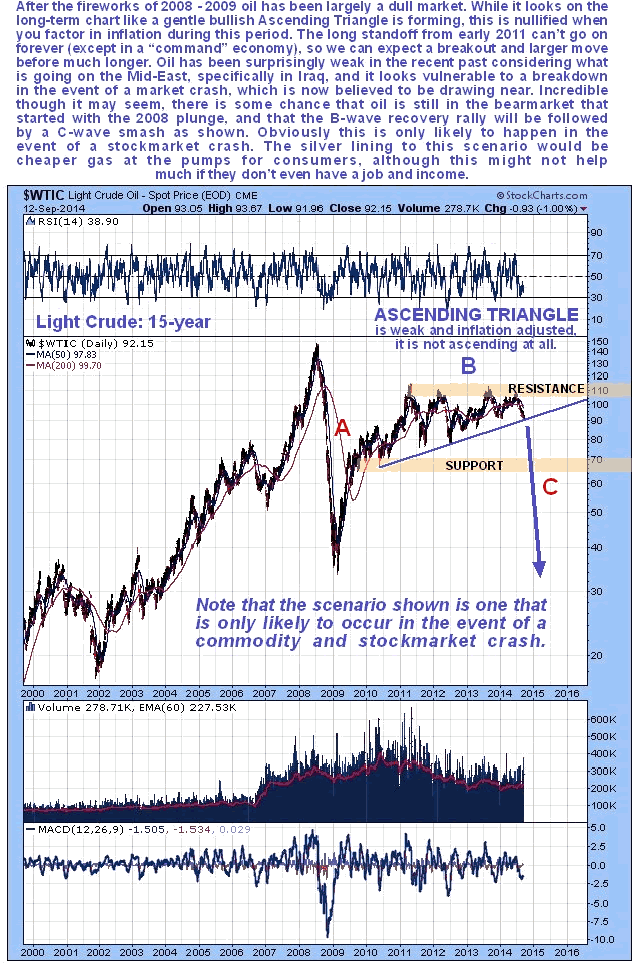
Returning to the charts, various commodity charts continue to look scary, showing a potential crash setup...
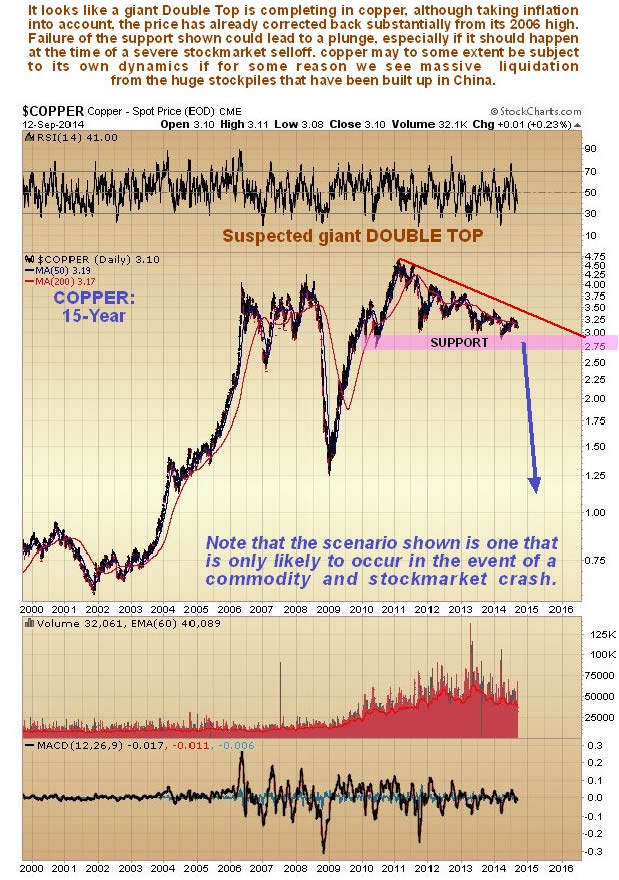
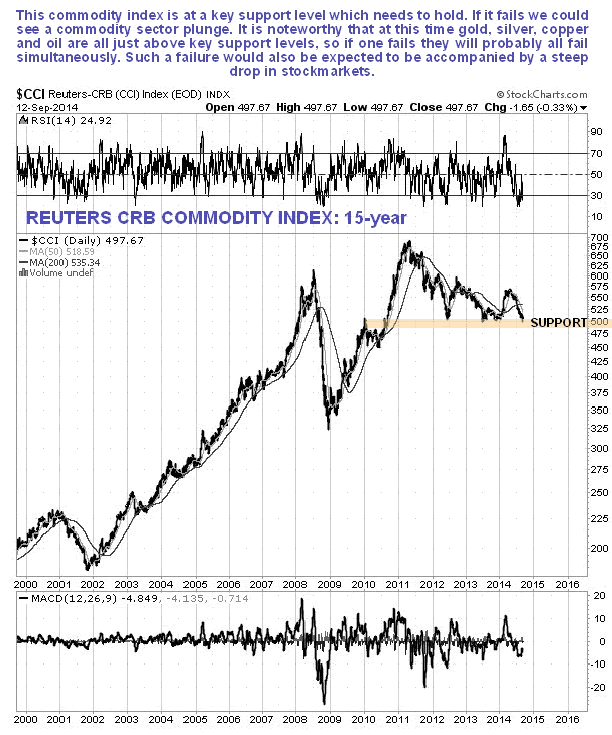
The general commodity index is also showing a dangerous setup - the support shown must hold...
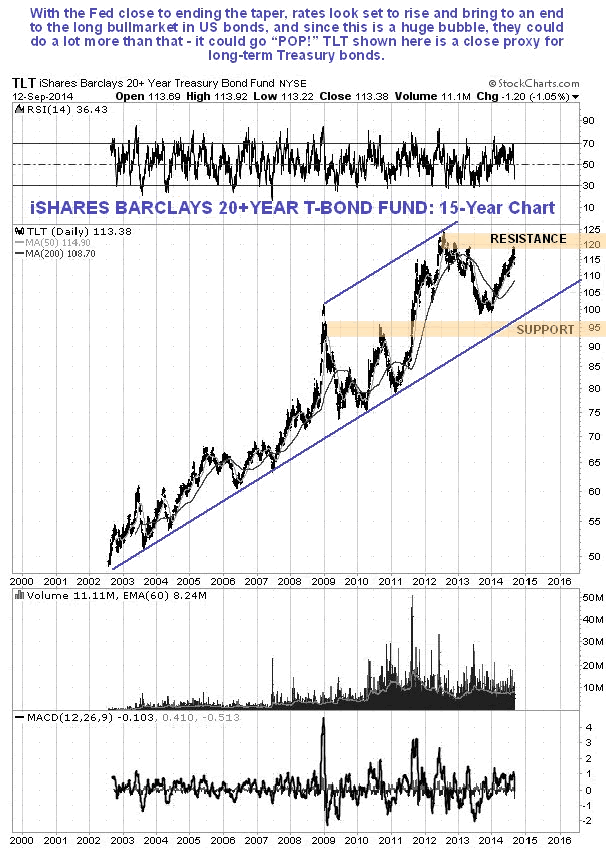
US Treasuries look particularly vulnerable after their long bullmarket if rates should start to rise...
By Clive Maund
CliveMaund.com
For billing & subscription questions: subscriptions@clivemaund.com
© 2014 Clive Maund - The above represents the opinion and analysis of Mr. Maund, based on data available to him, at the time of writing. Mr. Maunds opinions are his own, and are not a recommendation or an offer to buy or sell securities. No responsibility can be accepted for losses that may result as a consequence of trading on the basis of this analysis.
Mr. Maund is an independent analyst who receives no compensation of any kind from any groups, individuals or corporations mentioned in his reports. As trading and investing in any financial markets may involve serious risk of loss, Mr. Maund recommends that you consult with a qualified investment advisor, one licensed by appropriate regulatory agencies in your legal jurisdiction and do your own due diligence and research when making any kind of a transaction with financial ramifications.
Clive Maund Archive |
© 2005-2022 http://www.MarketOracle.co.uk - The Market Oracle is a FREE Daily Financial Markets Analysis & Forecasting online publication.


