How to Find Trading Opportunities in ANY Market Using Fibonacci Analysis
InvestorEducation / Learn to Trade Sep 17, 2014 - 01:12 PM GMTBy: EWI
 In this article, Elliott Wave International's Jeffrey Kennedy demonstrates ways to spot trading opportunities across any market and timeframe.
Elliott Wave International's Senior Analyst Jeffrey Kennedy is the editor of our Elliott Wave Trader's Classroom and one of our most popular instructors. Jeffrey's primary analytical method is the Elliott Wave Principle, but he also uses several other technical tools to supplement his analysis.
You can apply these methods across any market and any time frame.
Learn how you can get a free 14-page Fibonacci eBook at the end of this lesson.
The primary Fibonacci ratios that I use in identifying wave retracements are .236, .382, .500, .618 and .786. Some of you might say that .500 and .786 are not Fibonacci ratios; well, it's all in the math. If you divide the second month of Leonardo's rabbit example by the third month, the answer is .500, 1 divided by 2; .786 is simply the square root of .618.
There are many different Fibonacci ratios used to determine retracement levels. The most common are .382 and .618.
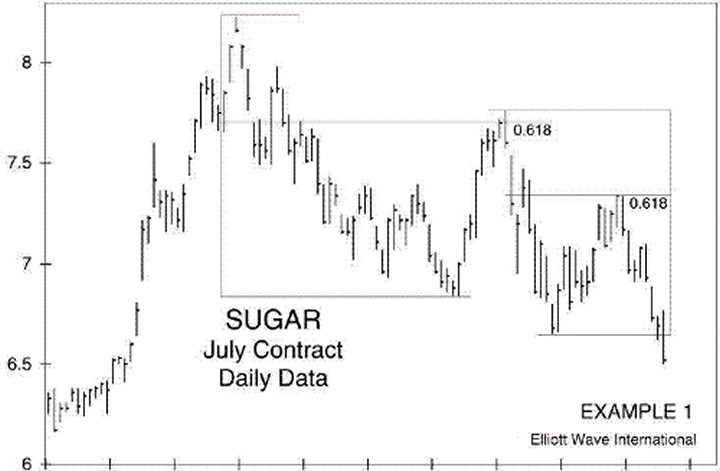
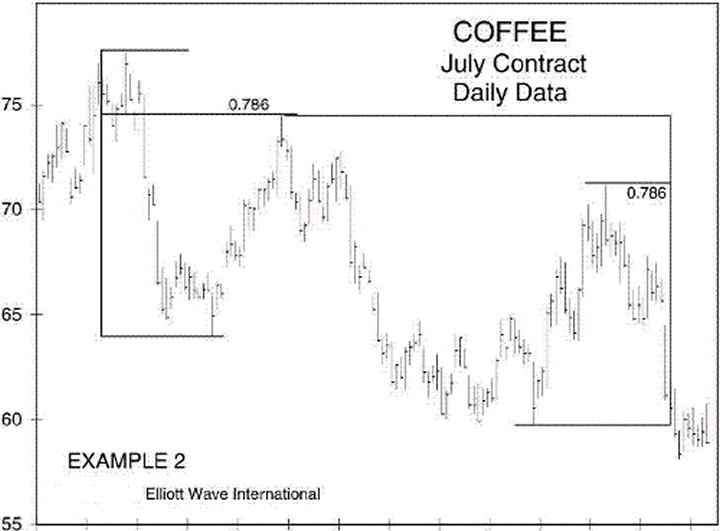
The accompanying charts also demonstrate the relevance of .236, .382, .500 .618 and .786. It's worth noting that Fibonacci retracements can be used on any time frame to identify potential reversal points. An important aspect to remember is that a Fibonacci retracement of a previous wave on a weekly chart is more significant than what you would find on a 60-minute chart.
With five chances, there are not many things I couldn't accomplish. Likewise, with five retracement levels, there won't be many pullbacks that I'll miss. So how do you use Fibonacci retracements in the real world, when you're trading? Do you buy or sell a .382 retracement or wait for a test of the .618 level, only to realize that prices reversed at the .500 level?

The Elliott Wave Principle provides us with a framework that allows us to focus on certain levels at certain times. For example, the most common retracements for waves two, B and X are .500 or .618 of the previous wave. Wave four typically ends at or near a .382 retracement of the prior third wave that it is correcting.

In addition to the above guidelines, I have come up with a few of my own over the past 10 years.
The first is that the best third waves originate from deep second waves. In the wave two position, I like to see a test of the .618 retracement of wave one or even .786. Chances are that a shallower wave two is actually a B or an X wave. In the fourth-wave position, I find the most common Fibonacci retracements to be .382 or .500. On occasion, you will see wave four retrace .618 of wave three. However, when this occurs, it is often sharp and quickly reversed.
My rule of thumb for fourth waves is that whatever is done in price, won't be done in time. What I mean by this is that if wave four is time-consuming, the relevant Fibonacci retracement is usually shallow, .236 or .382. For example, in a contracting triangle where prices seem to chop around forever, wave e of the pattern will end at or near a .236 or .382 retracement of wave three. When wave four is proportional in time to the first three waves, I find the .500 retracement significant. A fourth wave that consumes less time than wave two will often test the .618 retracement of wave three and suggests that more players are entering the market, as evidenced by the price volatility. And finally, in a fast market, like a "third of a third wave," you'll find that retracements are shallow, .236 or .382.
In closing, there are two things I would like to mention. First, in each of the accompanying examples, you'll notice that retracement levels repeat. Within the decline from the high in July Sugar (first chart), each countertrend move was a .618 retracement of the previous wave. The second chart demonstrates the same tendency with the .786 retracement. This event is common and is caused by the fractal nature of the markets.
Second, Fibonacci retracements identify high probability targets for the termination of a wave; they do not represent an absolute must-hold level. So when using Fibonacci retracements, don't be surprised to see prices reverse a few ticks above or below a Fibonacci target. This occurs because other traders are viewing the same levels and trade accordingly. Fibonacci retracements help to focus your attention on a specific price level at a specific time; how prices react at that point determines the significance of the level.
Learn How You Can Use Fibonacci to Improve Your TradingIf you'd like to learn more about Fibonacci and how to apply it to your trading strategy, download the free 14-page eBook, How You Can Use Fibonacci to Improve Your Trading. EWI Senior Tutorial Instructor Wayne Gorman explains:
See how easy it is to use Fibonacci in your trading. Download your free eBook today >> |
This article was syndicated by Elliott Wave International and was originally published under the headline How to Find Trading Opportunities in ANY Market: Fibonacci Analysis. EWI is the world's largest market forecasting firm. Its staff of full-time analysts led by Chartered Market Technician Robert Prechter provides 24-hour-a-day market analysis to institutional and private investors around the world.
About the Publisher, Elliott Wave International
Founded in 1979 by Robert R. Prechter Jr., Elliott Wave International (EWI) is the world's largest market forecasting firm. Its staff of full-time analysts provides 24-hour-a-day market analysis to institutional and private investors around the world.
© 2005-2022 http://www.MarketOracle.co.uk - The Market Oracle is a FREE Daily Financial Markets Analysis & Forecasting online publication.


