


Stock Market Bears Beyond All Doubt
Stock-Markets / Stock Markets 2014 Sep 16, 2014 - 06:30 PM GMTBy: Ed_Carlson

I have two pieces of good news this week (for bears).
- You will never again have to read about how the 2011 sideways movement has caused confusion over from which date to count the last basic advance in the 2009 bull market.
- Even if the sideways movement confusion had not been resolved previously, time has taken care of the any lingering uncertainties.
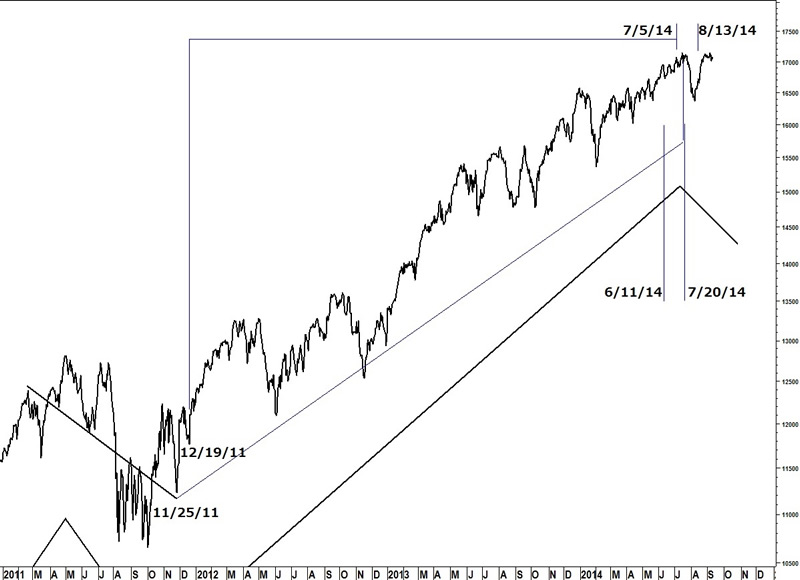
The last several months have been spent agonizing over from which low in the 2011 sideways movement to count the current basic advance. By using Lindsay’s standard time spans we can dramatically narrow down the time period in which to expect highs and lows but we have to know from which low to begin counting (it’s not always the lowest low).
Sideways movements are typically topping formations. When Lindsay wrote his explanation of why he chose the low in January 1927 to count the next basic advance from the 1926-1927 sideways movement it was only the second time in history to see a rally (rather than a decline) from this pattern and his reasons were less than specific. It was only after spending the last several months reviewing all the basic declines over the entire history of the Dow that I was satisfied that the low on 11/25/11 was the correct point of origin. But there was always that lingering fear. True, the Lindsay forecast for a top in the Dow (7/17/14) was off by only one day (the closing high was on 7/16/14) but what if the low on 12/19/11 was the correct date to count from? That would allow the basic advance to extend past the July high.
Any high must occur within a standard time span. The longest possible basic advance (929-968 days) from 12/19/11 expired on 8/13/14 and all the other, shorter time spans have expired too. The high on 7/16/14, at 964 days from the low on 11/25/11 was, beyond all doubt, the high of the 2009 bull market.
Get your copy of the September Lindsay Report at SeattleTA.
Ed Carlson, author of George Lindsay and the Art of Technical Analysis, and his new book, George Lindsay's An Aid to Timing is an independent trader, consultant, and Chartered Market Technician (CMT) based in Seattle. Carlson manages the website Seattle Technical Advisors.com, where he publishes daily and weekly commentary. He spent twenty years as a stockbroker and holds an M.B.A. from Wichita State University.
© 2014 Copyright Ed Carlson - All Rights Reserved
Disclaimer: The above is a matter of opinion provided for general information purposes only and is not intended as investment advice. Information and analysis above are derived from sources and utilising methods believed to be reliable, but we cannot accept responsibility for any losses you may incur as a result of this analysis. Individuals should consult with their personal financial advisors.
© 2005-2022 http://www.MarketOracle.co.uk - The Market Oracle is a FREE Daily Financial Markets Analysis & Forecasting online publication.