


The Collapse Of U.S. Silver Stocks As Public Debt Skyrockets
Commodities / Gold and Silver Stocks 2014 Sep 16, 2014 - 04:05 PM GMTBy: Steve_St_Angelo

 The U.S. Empire is in real trouble. This is due to its idiotic business model of selling quality assets while acquiring massive liabilities and debts. Of course, the U.S. Government realizes this is not a sustainable way to do business, but at least for now.... we continue to have our
 Bread & Circuses, McDonalds & NFL Football for a bit longer.
Furthermore, Americans have no clue that the role of the U.S. Dollar as the world's reserve currency continues to disintegrate each passing day as more countries elect to by-pass the Dollar and trade in other currencies... especially the Chinese Yuan.
The Total Liquidation of U.S. Silver Stocks
One such asset the U.S. Government totally liquidated is its massive stocks of silver. In 1940, the U.S. Treasury held 3,135,000,000 oz of silver. That's correct, 3.1 billion ounces. That is nearly four times the current annual world mine supply of 820 million oz.
This figure is documented on page 64 in the USGS 1940 Gold-Silver Minerals Yearbook:
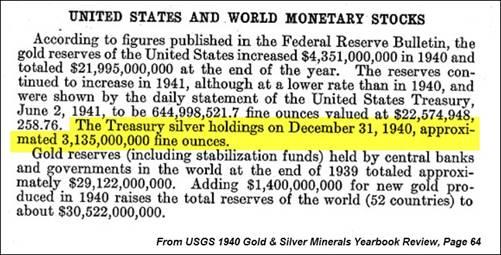
You will also notice that the U.S. held nearly $22 billion of the total $30.5 billion in world gold reserves. This was an amazing 72% (approximately 20,000 metric tons) of total world gold reserves.
Currently, the United States supposedly has 8,000 metric tons of gold in reserve. Unfortunately, we have no way of knowing how much gold is really there and if so, how many claims are on each ounce. Some analysts such as Harvey Organ, believe the U.S. gold vaults are totally empty.
While it's nearly impossible to know how much public gold remains in the vaults of the U.S. Government, we have a pretty good idea of its silver inventories.
This next chart shows the massive decline in U.S. silver stocks from 1940 to present. As you can see, silver stocks at the U.S. Treasury declined from 3.1 billion ounces in 1940 to 7 million ounces currently. This is a staggering 99.99% decline.
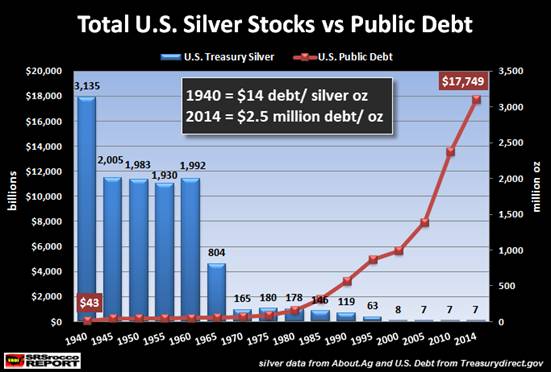
Now, if we look at the Red line on the chart, we can see the huge increase in U.S. debt. According to the TreasryDirect.gov August release, the U.S. debt increased to $17.7 trillion. Compare that to the paltry $43 billion of U.S. debt in 1940.
Interestingly, if we took the $43 billion (1940 U.S. debt) and divided it by 17.7 trillion (present U.S. debt), it would equal 0.24% or a stunning -99.76% difference. Thus we have the following:
Change from 1940 to 2014
U.S. Silver Stocks = -99.99%
U.S. Debt Ratio = 00.24% or -99.75%
Looking at in a different way, the U.S. Treasury had $14 of debt on its balance sheet for each ounce of its silver holdings in 1940, compared to $2.5 million of debt per ounce of silver currently. We can only guess if the U.S. Treasury holds the 7 million ounces it shows on its books as it hasn't updated that figure since 2000. (figures come from About.Ag)
U.S. Silver Production Falls More Than 50% Since 1940
Not only did silver stocks at the U.S. Treasury decline substantially over the past 70+ years, so did its domestic mine supply. The United States was one of the largest silver producers in the world in 1940.
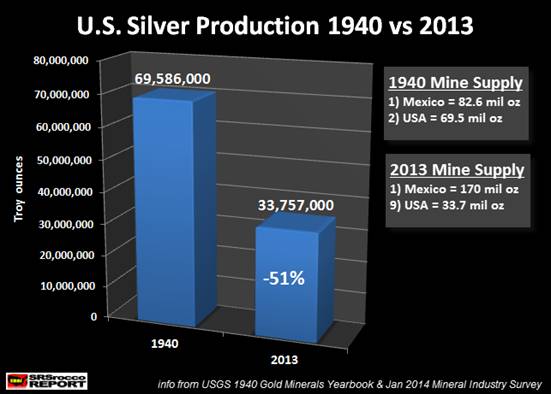
In 1940, the U.S. ranked second in the world by producing 69.5 million ounces of silver, while Mexico came in first at 82.6 million oz. Those were the good ole days when the United States manufactured and consumed the majority of its own goods.
Today, we see a much different story. The United States is no longer a major producer of silver. In 2013, Mexico remained the number one silver producer in the world at 170 million oz, while the U.S. fell to the ninth spot at 33.7 million oz. While Mexico more than doubled its silver production from 1940 to 2013, the U.S. did the opposite, suffering a 51% decline.
Why should the United States produce silver when Mexico and South American countries can do the hard work while the U.S. Federal Reserve can print all the Dollars it needs? Come on, this is no-brainer.
The Dow Jones-Silver Ratio
As the Fed and U.S. Treasury work hand in hand to prop up the Stock and Bond markets, the paper prices of gold and silver are manipulated lower. This can be seen by the change in the Dow Jones to silver ratio from 1940 to present.
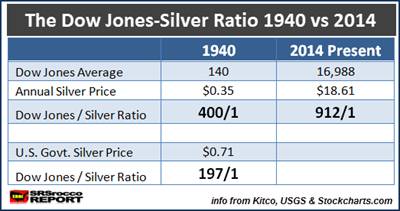
According to historical data taken from Stockcharts.com, I estimated the Dow Jones averaged 140 in 1940, while the market price of silver was $0.35 an ounce (Kitco.com). Thus, the Dow Jones-Silver Ratio was 400/1, compared to the lofty 912/1 presently.
If we apply the same Dow Jones-Silver Ratio of 400/1 in 1940 to the price of silver today, it would equal $42.43. Of course, the current price of silver is $18.61 due to the Fed and member banks siphoning its monetary liquidity in the U.S. Dollar-Bond-Stock Ponzi scheme and away from real assets such as gold and silver.
You see, this is a strange irony, because this wasn't always the case. If you look at the table above you will see the U.S. Govt. silver price of $0.71 in 1940. Even though the world market price of silver was $0.35, the U.S. Congress approved on July 6th, 1939 the purchase of domestic silver mine supply at $0.71 an ounce.
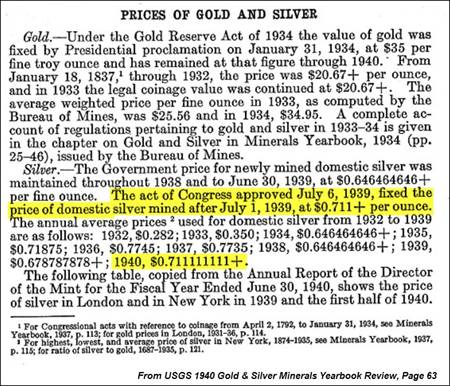
So, back in 1940 when gold and silver were money, the U.S. Govt. stepped in and INCREASED their value to maintain the monetary system. Here we can see, that Congress approved for the U.S. Treasury to purchase silver from its domestic mine supply at twice the market rate ($0.35 to $0.71).
What a difference today aye? First of all, Congress (except for a few like Ron Paul) today has no clue what money is. Secondly, the Fed and member banks are SUPPRESSING the price of gold and silver to maintain the last vestiges of the sinking U.S.S. Dollar
Matter-a-fact, two-thirds of the primary silver miners in my group stated losses during Q2 2014. Again, who gives a RAT's AZZ about the silver miners when you have the world's largest printing press?
Getting back to the Dow Jones-Silver Ratio, if we took the U.S. Govt. controlled price of silver in 1940 at $0.71, the Dow Jones-Silver Ratio would be 197/1. Taking that ratio and applying it to the current price of silver, it would equal $86.15 today. Which means, if the world was a better place and we had the Fed and Treasury on the side of REAL MONEY, the price of silver would be closer to the crazy $100 figure that most of the Silver Bears state as "INSANE."
Unfortunately, this isn't the case as the U.S. Government liquidated 99.99% of its silver inventories and the majority of its gold reserves. In return for pawning off the greatest hoard of Gold & Silver on the planet, the Fed now holds $4.4 trillion of worthless crap on its balance sheet, $2.4 trillion in U.S. Treasures Miseries and $1.7 trillion in MBS, Mortgaged Lacking Securities. (figures from federalreserve.gov August 2014 Report)
Then of course we have the $17.7 trillion in the "Official" stated debt of the United States. This doesn't include all the social welfare programs and all the off-balance sheet garbage.
I am simply amazed at the lack of character and insight of the walking dead analysts on Wall Street. This is also true for the BOZO's who think they are providing a service by commenting on precious metal blogs about the merits of owning U.S. Dollars and highly inflated stocks-bonds.
While it's true that the gold and silver market have taken a lot of punishment over the past several years, there's a good reason China, India and Russia continue to add to their gold hoards.
The day will come when an AVALANCHE of countries getting out of the Dollar will finally destroy its value. Unfortunately, the majority of Americans holding on to paper assets will be the last to know when this occurs, while precious metal investors saw it coming..... much later than they anticipated.
Please check back for updates at the SRSrocco Report and you can also follow us at Twitter:
![]()
2014 Copyright Steve St .Angelo - All Rights Reserved Disclaimer: The above is a matter of opinion provided for general information purposes only and is not intended as investment advice. Information and analysis above are derived from sources and utilising methods believed to be reliable, but we cannot accept responsibility for any losses you may incur as a result of this analysis. Individuals should consult with their personal financial advisors.
© 2005-2022 http://www.MarketOracle.co.uk - The Market Oracle is a FREE Daily Financial Markets Analysis & Forecasting online publication.