AUD USD Beware The Fake Out
Currencies / US Dollar Sep 10, 2014 - 10:45 AM GMTBy: Austin_Galt
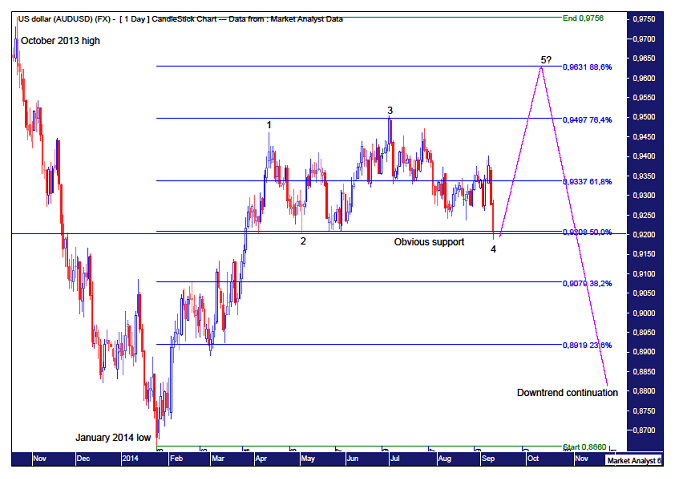
 The AUDUSD has been smashed the last couple of days. It has even busted through a well known support level. Many bulls would have stopped out of long positions on this move down while many bears would have shorted the break. I believe this to be a classic market deception. Let’s investigate starting with the daily chart.
DAILY CHART

I have drawn a horizontal line at the support level stemming from the May 2014 low of 92.03c. A lot of chartists are focusing on this support however to sell the break of this level seems too obvious. I believe it is a fake out. A false break which should see price reverse fairly quickly and charge back up.
There may well be a 5 point broadening top playing out. I have drawn the numbers 1,2,3,4 and 5?. I suspect this move lower today is setting up point 4 with one final surge into high at 5?. Where will the final point 5 be?
As I have outlined in previous reports, I am looking for the rally to end around the 88.6% retracement level of the downleg from the October 2013 to January 2014 low. This level stands at 96.31c.
Let’s now look at the monthly chart.
MONTHLY CHART

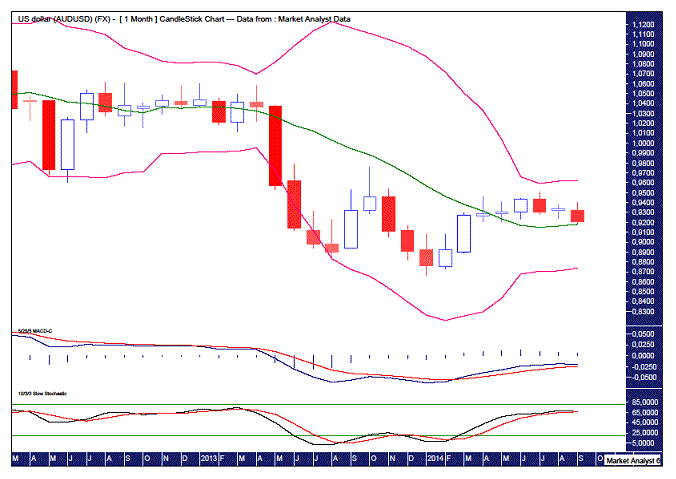
I have added a Moving Average Convergence Divergence (MACD) indicator which is trending up with the blue line above the red line indicating a bias should be given to higher prices. However, it is in weak territory consistent with bear market rallies.
I have added a Stochastic indicator which is also trending up albeit a bearish crossover does look to be in the midst.
Finally, I have added Bollinger Bands which shows this recent move coming back to the middle band. I favour one final fling up to the upper band to end the rally once and for all. The upper band currently stands at 96.2c. Only 10 pips from the 88.6% Fibonacci level. Hmmm.
I suspect September will see a big reversal and end up being a bullish outside reversal month. In fact, it is my opinion that the September price range will encompass the whole trading range since April 2014. That is the low is lower than 92.03c (already done) while the high will be higher than 95.04c. Let’s see.
In conclusion, a move down like we have witnessed the last couple of days can be quite intimidating. It’s a bit like catching a falling knife. I won’t be involved as I generally don’t like trading against the main trend. Instead, I continue to wait patiently for the next big play short opportunity which I expect to occur when the AUDUSD gets up above 96c.
Until then…………..
By Austin Galt
Austin Galt is The Voodoo Analyst. I have studied charts for over 20 years and am currently a private trader. Several years ago I worked as a licensed advisor with a well known Australian stock broker. While there was an abundance of fundamental analysts, there seemed to be a dearth of technical analysts. My aim here is to provide my view of technical analysis that is both intriguing and misunderstood by many. I like to refer to it as the black magic of stock market analysis.
© 2014 Copyright The Voodoo Analyst - All Rights Reserved
Disclaimer: The above is a matter of opinion provided for general information purposes only and is not intended as investment advice. Information and analysis above are derived from sources and utilising methods believed to be reliable, but we cannot accept responsibility for any losses you may incur as a result of this analysis. Individuals should consult with their personal financial advisors.
© 2005-2022 http://www.MarketOracle.co.uk - The Market Oracle is a FREE Daily Financial Markets Analysis & Forecasting online publication.


