


Here's Why Trendlines Are Your New Best Friend, Part 2
InvestorEducation / Learn to Trade Sep 10, 2014 - 10:38 AM GMTBy: EWI

 See how trendlines help you manage risk in this real-world example from this free eBook
One of the best aspects of technical analysis is also its biggest drawback: Namely, there are far too many indicators to choose from.
Candlesticks to channels, Relative Strength Index to Bollinger Bands, double tops to moving averages...
Geez! With so many options, you're liable to feel like a "hanging man" beneath "dark cloud cover."
But in reality, all you need is one good, solid place to start; one indicator that can be your technical rock of Gibraltar.
For Elliott Wave International's chief commodity analyst Jeffrey Kennedy, that honor goes to one of the oldest names in the book: trendlines. Back in 2004, Jeffrey went on the record with this tribute:
I believe that trendlines are one of the simplest, yet most powerful tools an analyst can employ. An early mentor of mine said it best when he pointed out that "a kid with a ruler could make a million dollars" by simply drawing trendlines on price charts.
Last week, we showed you how Jeffery used an easily-drawn trendline to anticipate a bullish breakout point in cocoa back in early May.
Today, we're following up with another real-world example, only this time, you'll see how Jeffrey used trendlines to identify lasting levels of price resistance in the most popular grain market, corn.
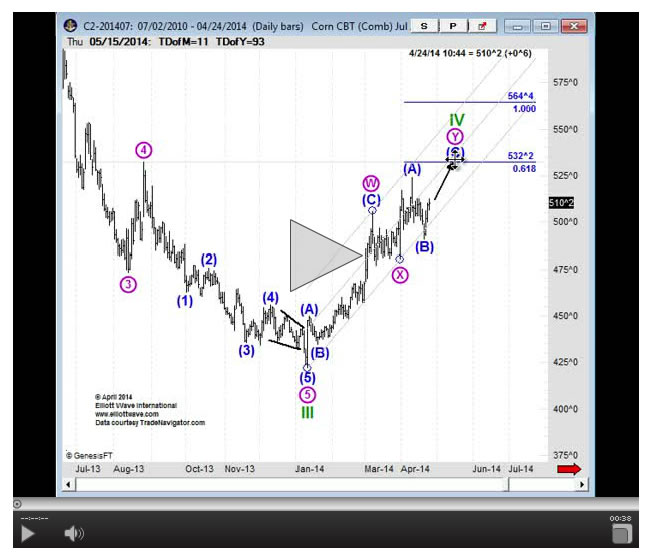
In his April 2014 Monthly Commodity Junctures Wave Watch video, Jeffrey showed subscribers how a four-month old trendline ensured that corn's upside was limited:
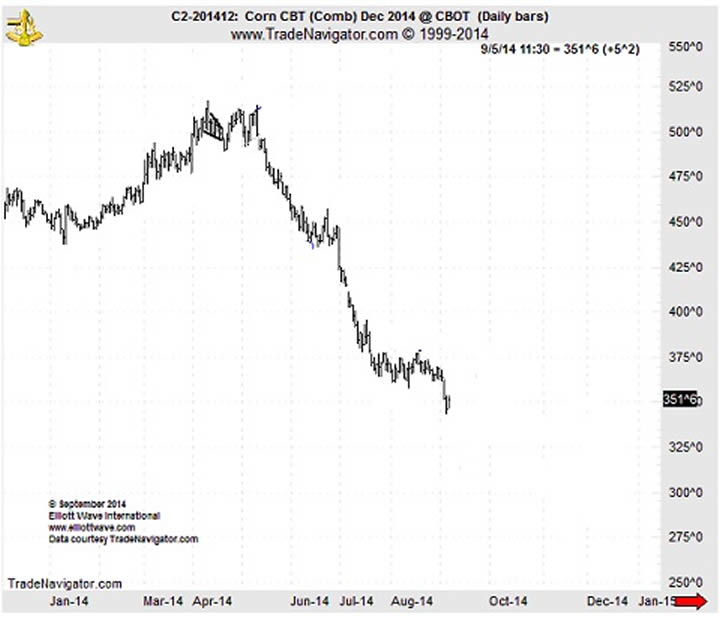
The next chart shows you how corn prices did indeed bump up against their long-time trendline, reversed, and sold off in a powerful decline to their lowest level not just for 2014 -- but their lowest level in four years.
Jeffrey finds trendlines so valuable that he wrote a book about them!
Well, an eBook: a (free) 17-pager titled "Trading the Line: 5 Ways You Can Use Trendlines to Improve Your Trading."
Here's another excerpt:
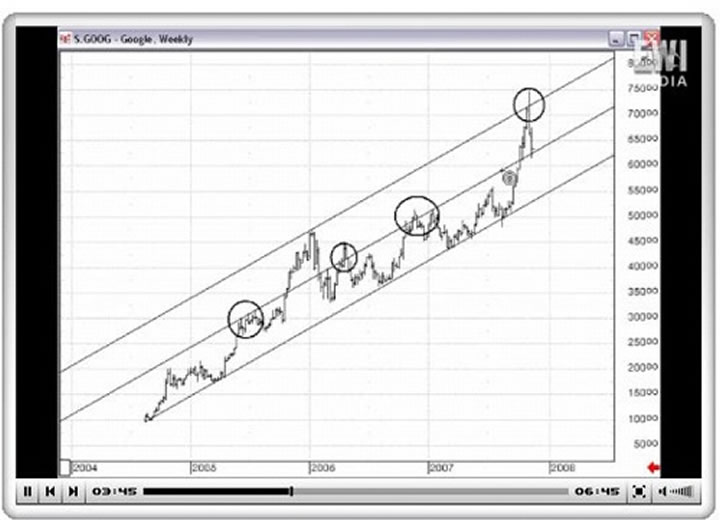
Look where the upper boundary line provided resistance [in Google]. Notice there is another use for it. The midpoint of the trendline provides resistance in four different areas, which is why I include the center point or the midline when I draw parallel trendlines or price channels.
As the title of Jeffrey's eBook states, there are 5 ways trendlines improve your trading:
- Trendlines show you the dominant psychology of investors, be it bullish or bearish
- They define your support and resistance price levels
- They give you advanced warning of potential price breakout points
- They help you identify critical moments in time
- Trendlines also tell you when the trend has turned
Want to learn how to draw your own trendlines -- and gain an advantage you've never had before?
Right now, our friends over at Elliott Wave International have the entire 17-page eBook on their shelf of FREE trader resources. It's yours for the reading, right now -- at absolutely no cost.
This article was syndicated by Elliott Wave International and was originally published under the headline Here's Why Trendlines Are Your New Best Friend, Part 2. EWI is the world's largest market forecasting firm. Its staff of full-time analysts led by Chartered Market Technician Robert Prechter provides 24-hour-a-day market analysis to institutional and private investors around the world.
About the Publisher, Elliott Wave International
Founded in 1979 by Robert R. Prechter Jr., Elliott Wave International (EWI) is the world's largest market forecasting firm. Its staff of full-time analysts provides 24-hour-a-day market analysis to institutional and private investors around the world.
© 2005-2022 http://www.MarketOracle.co.uk - The Market Oracle is a FREE Daily Financial Markets Analysis & Forecasting online publication.