


AUDNZD Another Pullback Forex Trading Opportunity?
Currencies / Forex Trading Sep 09, 2014 - 05:50 PM GMTBy: Austin_Galt

 Since my last report on the AUDNZD, price has embarked on a nice uptrend hitting a high last week just shy of $1.13. It really has been one way traffic. Northbound that is. However, last Friday saw the first sign that the next decent pullback opportunity may be upon us. Let''s investigate.
AUDNZD Daily Chart
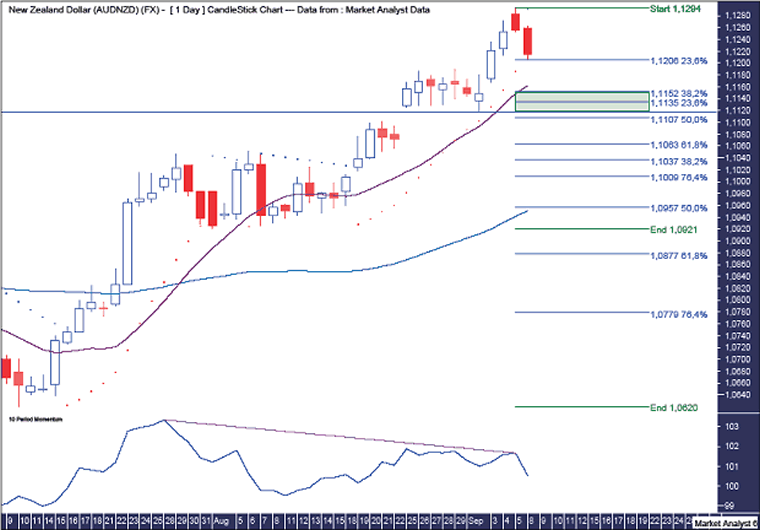
We can see Friday''s bearish candle is the first real sign of a reversal since the correctional phase in July/August. I have added a Momentum indicator which shows price has lost a bit of momentum since then. Nothing too dramatic but a pullback would suit here.
I have added two sets of Fibonacci retracement levels. The first are of the upleg from the major July low to recent highs and the second are of the upleg from the recent August low to recent high.
Let''s start with the first upleg. This is a strong uptrend and retracements have confirmed this by being weak. The pullback into August was around the 23.6% level. I also favour a similar pullback now and the 23.6% level stands at $1.1135.
This level is just below the 38.2% retracement level of the second upleg and stands at $1.1152. I favour a move back down to around these levels.
I have drawn a horizontal line which refers to the previous swing low set on the 2nd September and stands at $1.1118. I doubt price will go below there.
I have drawn a green highlighted rectangle which denotes the area I am looking for the pullback to end. The top of the rectangle is the 38.2% level of the second upleg while the bottom of the rectangle is the previous swing low.
I have also added 14 period (purple line) and 50 period (blue line) moving averages. We can see the 14ma has really diverged from the 50ma so some regression to the mean looks in order here.
I have added a Parabolic Stop and Reverse (PSAR) indicator which shows the dots being busted to the downside today. That suggests a pullback is already underway. A pullback will be just the tonic to relieve the positivity and allow price to muster more energy for its next upside assault.
AUDNZD Weekly Chart
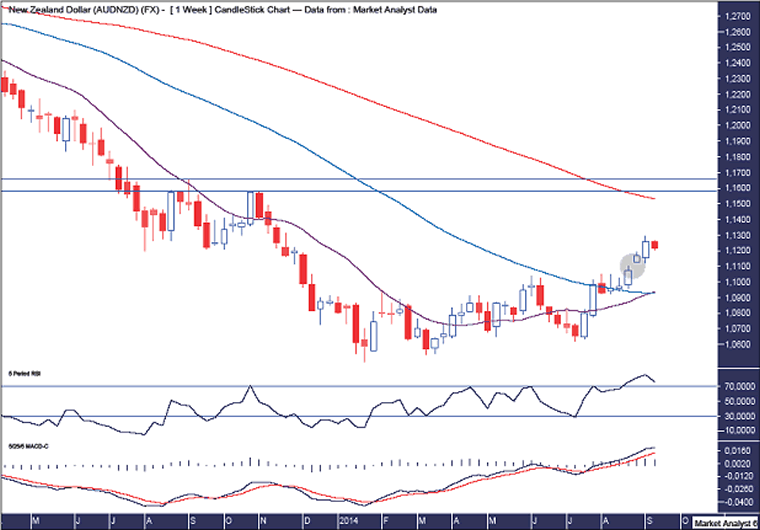
I have added a Relative Strength Indicator (RSI) which shows a strong move up into overbought territory. The RSI reading just hit a high at 85 and while high there is certainly room to go higher and become more overbought.
The Moving Average Convergence Divergence (MACD) indicator shows the averages starting to diverge. Perhaps if price can consolidate last week''s gains then the averages can come back a bit closer together thereby relieving some of the bullish pressure. Also, the MACD has just recently crossed over into positive territory so there is still plenty of upside potential.
I have added some moving averages with time periods of 14 (purple), 50 (blue) and 100 (red). The 50ma looks close to making a bullish crossover with the 50ma. The 100ma is still overhead above $1.15. That level could be viewed as one potential price target.
I have also drawn a horizontal line which denotes the previous swing high set in September 2013 at $1.1654. Perhaps price will take out that level before a more significant correction takes place. Let''s see.
Finally, I have drawn a green highlighted circle which shows a gap in place made a couple of weeks ago. At some stage this gap is likely to be filled. However, to my eye, it looks like a breakaway gap that should lead to higher prices before being filled. So I doubt the current move down will fill it. Filling it now would indicate some weakness and I just don''t see it. Not yet anyway. Not the be all and end all. Just something to keep in mind.
The AUDNZD has already had a good run and after the current pullback I expect the good times to keep on rolling.
By Austin Galt
Austin Galt is The Voodoo Analyst. I have studied charts for over 20 years and am currently a private trader. Several years ago I worked as a licensed advisor with a well known Australian stock broker. While there was an abundance of fundamental analysts, there seemed to be a dearth of technical analysts. My aim here is to provide my view of technical analysis that is both intriguing and misunderstood by many. I like to refer to it as the black magic of stock market analysis.
© 2014 Copyright The Voodoo Analyst - All Rights Reserved
Disclaimer: The above is a matter of opinion provided for general information purposes only and is not intended as investment advice. Information and analysis above are derived from sources and utilising methods believed to be reliable, but we cannot accept responsibility for any losses you may incur as a result of this analysis. Individuals should consult with their personal financial advisors.
© 2005-2022 http://www.MarketOracle.co.uk - The Market Oracle is a FREE Daily Financial Markets Analysis & Forecasting online publication.