S&P Developing Bullish Pattern, While Crude Oil Still Refuses to Rest
Stock-Markets / Exchange Traded Funds May 16, 2008 - 12:43 AM GMTBy: Mike_Paulenoff

 Thursday morning I posted a weekly S&P 500 chart for subscribers noting:
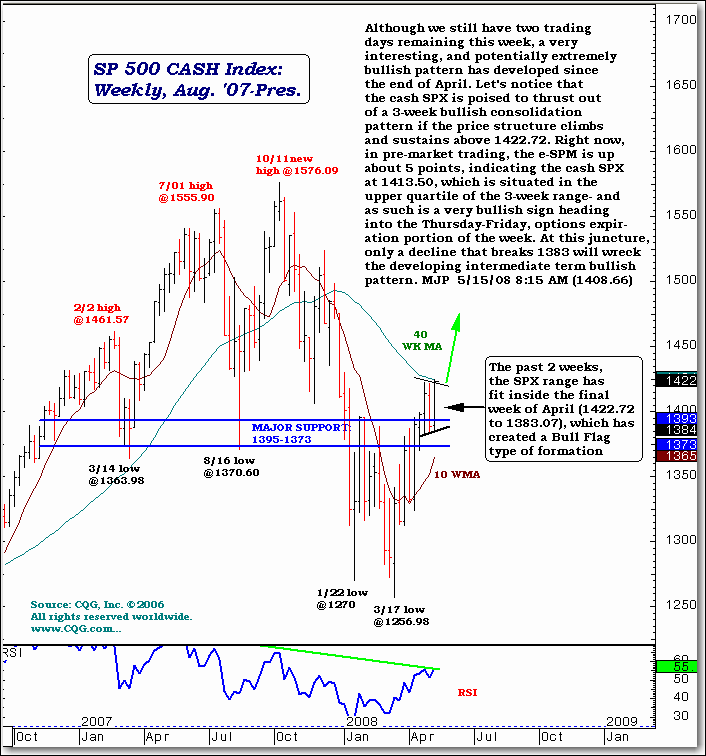
"Although we still have two trading days remaining this week, a very
interesting and potentially extremely bullish pattern has developed since
the end of April. Let's notice that the cash SPX is poised to thrust out of
a 3-week bullish consolidation pattern if the price structure climbs and
sustains above 1422.72."
As of Thursday's close, the cash SPX was at 1423.57, a new high for the move, and one that suggests the index is emerging from its 3-week bullish consolidation pattern. The index's range since the final week of April has been 1383.07 to 1422.72, which has created a bull flag type of formation. At this juncture only a decline that breaks 1383 will wreck the developing intermediate-term bullish pattern.

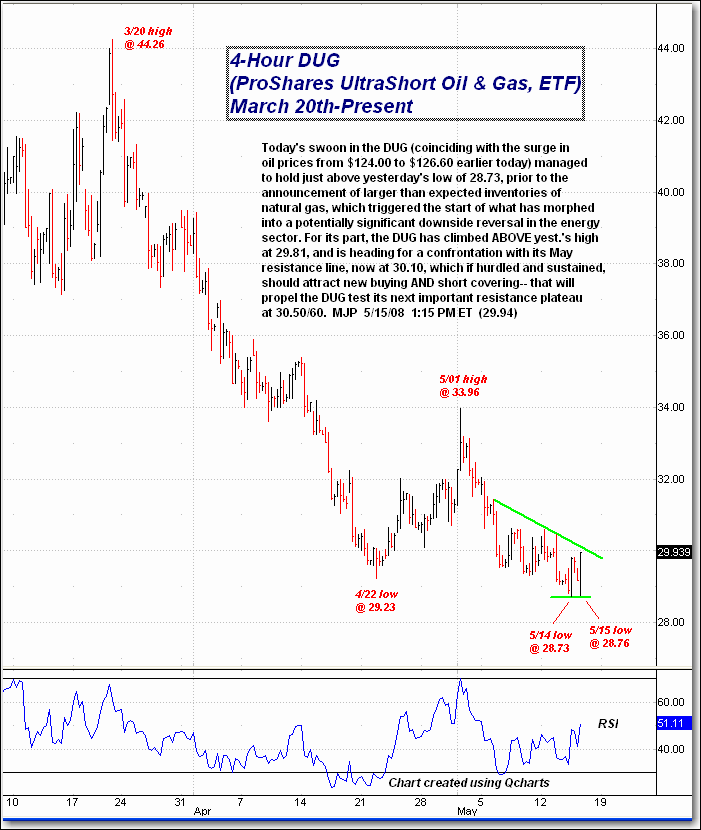
The rally in equities comes despite oil's relentless climb, although my technical work on the DUG, the ProShares UltraShort Oil & Gas ETF, suggests that ETF may have some upside shortly.
Thursday's swoon in the DUG (coinciding with the surge in oil prices from $124.00 to $126.00 earlier in the day) managed to hold just above Wednesday's low of 28.73, prior to the announcement of larger-than-expected inventories of natural gas, which triggered the start of what morphed into a potentially significant downside reversal in the energy sector.
The DUG climbed above Wednesday's high at 29.81, heading for a confrontation with its May resistance line, now at 30.10, before selling off sharply in late afternoon. If that 30.10 level is hurdled and sustained, that should attract new buying AND short covering that will propel the DUG to test its next important resistance plateau at 30.50/60.

Sign up for a free 15-day trial to Mike's ETF Trading Diary today.
By Mike Paulenoff
Mike Paulenoff is author of the MPTrader.com (www.mptrader.com) , a real-time diary of Mike Paulenoff's trading ideas and technical chart analysis of Exchange Traded Funds (ETFs) that track equity indices, metals, energy commodities, currencies, Treasuries, and other markets. It is for traders with a 3-30 day time horizon, who use the service for guidance on both specific trades as well as general market direction
© 2002-2007 MPTrader.com, an AdviceTrade publication. All rights reserved. Any publication, distribution, retransmission or reproduction of information or data contained on this Web site without written consent from MPTrader is prohibited. See our disclaimer.
Mike Paulenoff Archive |
© 2005-2022 http://www.MarketOracle.co.uk - The Market Oracle is a FREE Daily Financial Markets Analysis & Forecasting online publication.


