


Here's Why Trendlines Are a Traders Best Friend
InvestorEducation / Learn to Trade Sep 04, 2014 - 08:17 AM GMTBy: EWI

 See how trendlines show you lasting price levels of risk-defining support in this real-world example from this free eBook
If financial market speculation were easy, then everyone would be well off -- and the legendary investor Warren Buffett would be just a nice rich guy from Omaha with really cool glasses.
The reality is, successfully navigating the near- and long-term trends is exceptionally difficult. Gains can be big, but losses can often be even bigger.
Technical analysis offers you an all-you-can-watch buffet of indicators to help reduce your risk and optimize rewards. You may already be using moving averages or momentum indicators, for example -- and you know how helpful they can be at anticipating trend changes.
Well, let us introduce you to another excellent tool: trendlines.
For the past 15 years, Elliott Wave International's chief commodity analyst Jeffrey Kennedy has been using trendlines to identify high-probability trade set-ups in close to 20 markets he regularly follows.
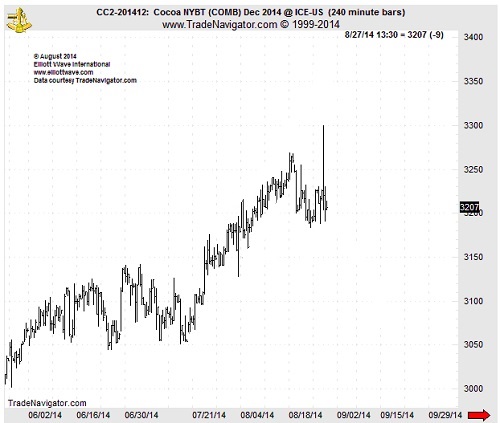
You might be familiar with one of those markets, cocoa. In his May 2014 Monthly Commodity Junctures, Jeffrey showed subscribers how to apply trendlines to this volatile market:
So, the forecast was for cocoa to hold above the trendline -- and rally. The next chart shows you how cocoa prices did just that, soaring straight into Jeffrey's cited price target of 3200:
Jeffrey finds trendlines so valuable that he wrote a book about them! Well, an eBook: a 17-pager titled "Trading the Line: 5 Ways You Can Use Trendlines to Improve Your Trading."
Here's an excerpt:
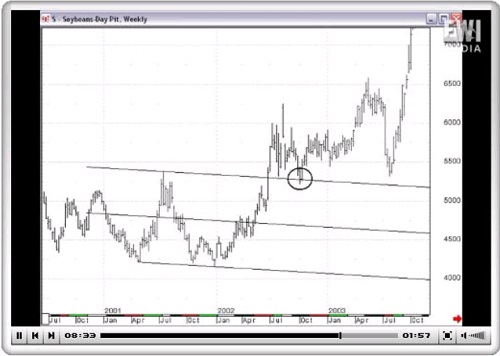
Now here's a neat little trick. In Figure 2-9, we use trendlines a different way. By connecting the two lines, we distinguish the breakout point. Later, it provides support when prices revisit the same line (circled).
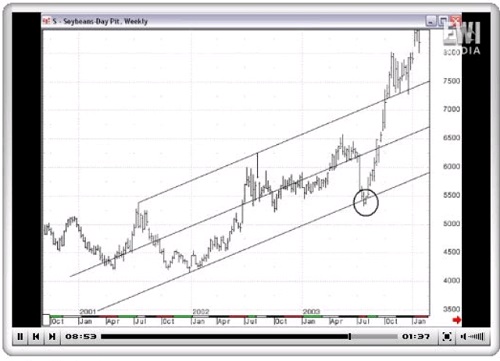
Or, we can count the highs and take it from an intervening low, as seen in this soybean weekly chart. The reversal that occurred in price at the lower boundary line is circled.
As the title of Jeffrey's eBook states, there are 5 ways trendlines improve your trading:
- Trendlines show you the dominant psychology of investors, be it bullish or bearish
- They define your support and resistance price levels
- They give you advanced warning of potential price breakout points
- They help you identify critical moments in time
- Trendlines also tell you when the trend has turned
Want to learn how to draw your own trendlines -- and gain an advantage you've never had before?
Right now, our friends over at Elliott Wave International have the entire 17-page eBook on their shelf of FREE trader resources. It's yours for the reading, right now -- at absolutely no cost.
About the Publisher, Elliott Wave International
Founded in 1979 by Robert R. Prechter Jr., Elliott Wave International (EWI) is the world's largest market forecasting firm. Its staff of full-time analysts provides 24-hour-a-day market analysis to institutional and private investors around the world.
© 2005-2022 http://www.MarketOracle.co.uk - The Market Oracle is a FREE Daily Financial Markets Analysis & Forecasting online publication.