


3 Important Gold Charts - Transparent Holdings Fall As Bullion Goes East To Russia and China
Commodities / Gold and Silver 2014 Sep 02, 2014 - 05:44 PM GMTBy: GoldCore

 Nick Laird of www.ShareLynx.com has compiled some great new charts on the transparency of public gold holdings over time. The charts were emailed to us Monday night. Sharelynx.com is one of the internet’s most comprehensive sources for market related charts and is well worth the subscription. The charts are very illuminating and provide great insight into how gold has shifted between non public sources and public sources over the last 10-12 years. Below we reproduce some of Nick’s charts and some GoldCore commentary on the trends that we find most interesting.
Chart 1: Changes in Holdings (millions of oz) vs Gold Price
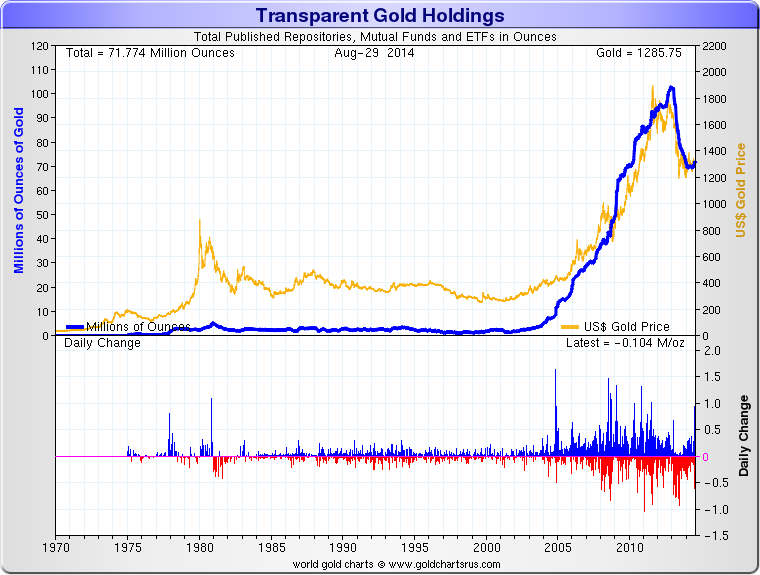
In his charts, Nick has defined transparent gold holdings as “Total Published Repositories, Mutual Funds and ETFs”, and the gold holdings in millions of ounces are derived from these sources. The data therefore covers known private holdings of gold but excludes both the holdings of central banks, the official sector, and holdings in private ownership including for example GoldCore Secure Storage holdings.
The first chart shows a long term view of transparent gold holdings since 1970. As the gold bull market began in the late 1990s, the amount of gold held in transparent holdings rose sharply and displays a very high correlation with the rising gold price.
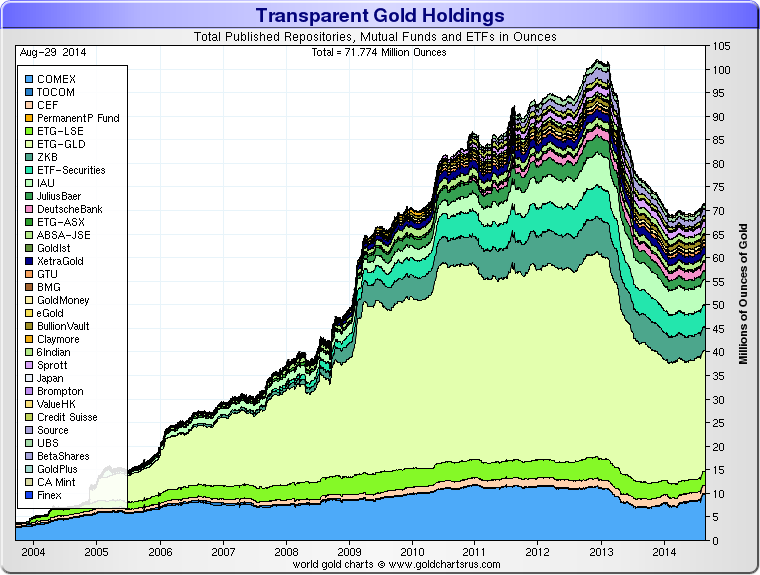
Chart 2: Total Ounces by Source 2004-2014
While there would obviously be some data issues in collecting gold holdings data from periods such as the 1970s and 1980s, more importantly, there was a very limited choice of accessible gold vehicles and the futures markets were in their infancy. It was only since the early 2000s that the choice of gold vehicles, and therefore high quality holdings information, became available.
Beginning in 2001, when only a few millions ounces of private gold holdings could be tracked through publically available sources, the amount of gold held in public repositories exploded as the gold price rose, reaching 20 million ounces in 2006, 50 million ounces by 2009, and over 100 million ounces by the beginning of 2013.
Interestingly, as the gold price peaked in 2011, the amount of gold flowing into ETFs, mutual funds and other public repositories kept increasing and only peaked In January 2013 as the gold price began its fall from $1,700/oz through to $1,300/oz.
Chart 2 shows a ten year view from 2004 to 2014 and drills down into the sources that make up the transparent gold holdings totals.
These sources include everything from COMEX and the GLD ETF to the iShares ETF and the Central Fund of Canada, and also publically available data on some of the smaller ETFs and online gold retailers.
While the holdings represented by the futures exchange did grow over the 2000s, their growth was quite stable. By far the largest growth in trackable gold holdings was in the GLD and the other large ETFs such as the ETF Securities and iShares products.
Gold holdings in GLD grew consistently from 2005 to 2009, but then rocketed up from 2009 to 2011 before stabilising until the end of 2013. As has been documented elsewhere, there was then a huge outflow from GLD. The trend in the other ETFs is similar although on a smaller scale.
Chart 3: Total Weight (millions of oz) vs Total Value
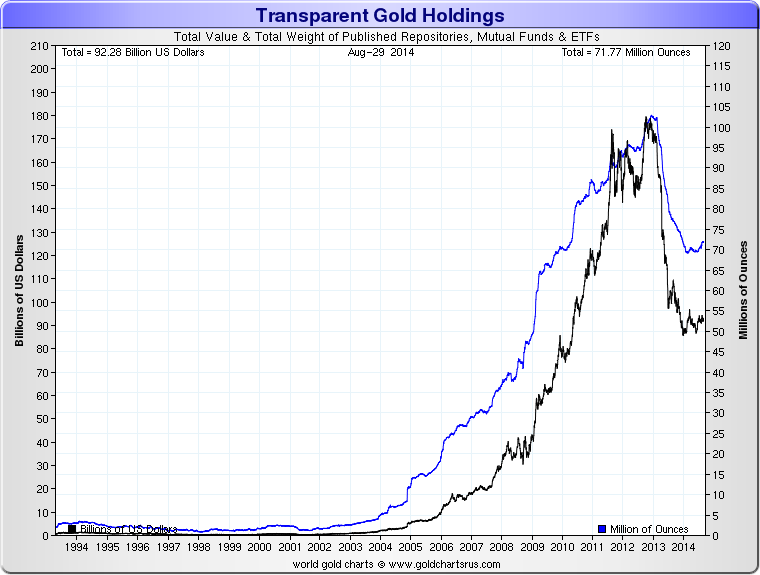
Chart 3 compares total weight of gold held to total value in US dollars of those holdings. The key takeaway from this chart is that, again, as the price of gold rose, there was a huge mobilisation of gold out of non publicly tracked sources into vehicles and on to exchanges where it could be publically tracked. This mobilisation of gold at its peak was somewhere between 90 million and 100 million ounces (2800 tonnes - 3100 tonnes).
The question is where did all this gold come from? Some would obviously have been from new mine supply, some probably from central bank sales, and some from dis-hoarding out of private hoards. Although HNW investors were more likely to have been buying gold in the years immediately preceding the global financial crisis and almost certainly were buying during the financial crisis.
An equally important question is that now that the public repositories have lost 30 million ounces in under 2 years, where has all that gold gone?
It would be realistic to assume that some has gone to China and the Far East since there has been evidence of such flows. Equally its possible that some of the gold that has disappeared from the ETFs and other products and sources has again gone back into private hoards or else is being accumulated by the official sector such as emerging market central banks such as the Russian central bank and the People’s Bank of China (PBOC).
We discussed this, ‘peak gold’, Russian gold buying and producing and Russia and China's plans for gold in a short interview at the weekend:
View here
MARKET UPDATE Today’s AM fix was USD 1,277.75, EUR 974.42 and GBP 773.27 per ounce. Yesterday’s AM fix was USD 1,287.25, EUR 979.34 and GBP 774.47 per ounce. Yesterday’s PM fix was USD 1,286.50, EUR 979.44 and GBP 773.84 per ounce.
The US markets were closed for a national holiday yesterday.
Gold in Singapore fell by $10 in illiquid trading prior to further falls in London which saw gold fall to $1,270/oz. Silver slipped $0.30 or 1.55% to $19.17 per ounce in London trading.
Platinum is down 0.35% to $1,420 after falling from $1,426. Palladium failed to hold above the key $900 level and fell 2% today to $890 from $909 yesterday.
Despite ongoing significant geopolitical tensions in Ukraine and elsewhere, gold has not managed to break above $1,300/oz. It continues to trade at the lower end of a tight trading range between $1,270/oz and $1,300/oz. Silver, likewise, has followed gold lower.
This update can be found on the GoldCore blog here.
Yours sincerely,
Mark O'Byrne
Exective Director
IRL |
UK |
IRL +353 (0)1 632 5010 |
WINNERS MoneyMate and Investor Magazine Financial Analysts 2006
Disclaimer: The information in this document has been obtained from sources, which we believe to be reliable. We cannot guarantee its accuracy or completeness. It does not constitute a solicitation for the purchase or sale of any investment. Any person acting on the information contained in this document does so at their own risk. Recommendations in this document may not be suitable for all investors. Individual circumstances should be considered before a decision to invest is taken. Investors should note the following: Past experience is not necessarily a guide to future performance. The value of investments may fall or rise against investors' interests. Income levels from investments may fluctuate. Changes in exchange rates may have an adverse effect on the value of, or income from, investments denominated in foreign currencies. GoldCore Limited, trading as GoldCore is a Multi-Agency Intermediary regulated by the Irish Financial Regulator.
GoldCore is committed to complying with the requirements of the Data Protection Act. This means that in the provision of our services, appropriate personal information is processed and kept securely. It also means that we will never sell your details to a third party. The information you provide will remain confidential and may be used for the provision of related services. Such information may be disclosed in confidence to agents or service providers, regulatory bodies and group companies. You have the right to ask for a copy of certain information held by us in our records in return for payment of a small fee. You also have the right to require us to correct any inaccuracies in your information. The details you are being asked to supply may be used to provide you with information about other products and services either from GoldCore or other group companies or to provide services which any member of the group has arranged for you with a third party. If you do not wish to receive such contact, please write to the Marketing Manager GoldCore, 63 Fitzwilliam Square, Dublin 2 marking the envelope 'data protection'
GoldCore Archive |
© 2005-2022 http://www.MarketOracle.co.uk - The Market Oracle is a FREE Daily Financial Markets Analysis & Forecasting online publication.