


Stock Market Inflection Point Approaching
Stock-Markets / Stock Markets 2014 Aug 30, 2014 - 04:08 PM GMTBy: Tony_Caldaro

 The market started the week with a gap up opening on monday, hit SPX 2005 on tuesday before noon, then traded in a 14 point range for the rest of the week. For the week the SPX/DOW were +0.7%, the NDX/NAZ were +0.8%, and the DJ World index gained 0.6%. On the economic front positive reports outpaced negatives ones, led by a Q2 GDP +4.2%. On the uptick: new/pending homes sales, durable goods orders, the FHFA, consumer confidence/sentiment, Q2 GDP, personal income, the PCE, and the Chicago PMI. On the downtick: the WLEI, Case-Shiller, and personal spending. Next week will be highlighted by the FED’s beige book, ISM, and the Payrolls report.
LONG TERM: bull market
As we start our 10th year of publishing this blog it appears the market is entering another inflection point. The bulls have won them all since 2010, with the exception of 2011. Is another exception in the offering, or is Primary III set to extend once again? The next several days to weeks will give us the answer.
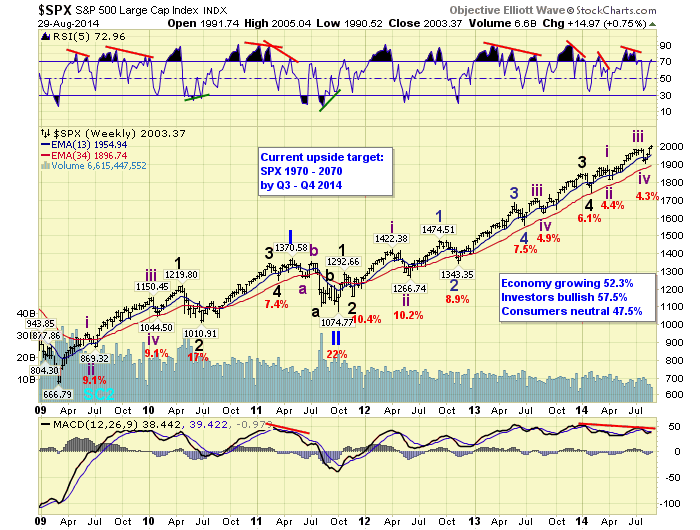
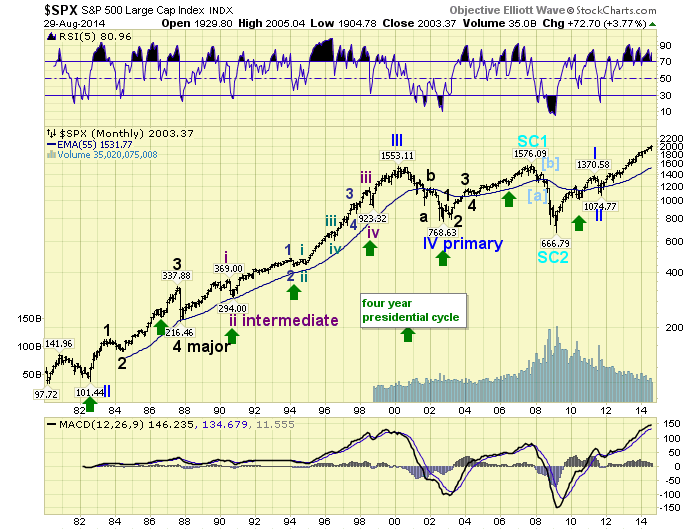
Last weekend we offered a potential alternate count should Primary III extend. Yet, we continue to follow our main count which has worked well for us this year. As you can see from the weekly chart: the SPX should be in Intermediate wave v, of Major 5, of Primary III. When this uptrend concludes, Primary III ends, and the largest correction since 2011 should follow for Primary IV. Supporting this scenario are the negative divergences in the weeklly MACD/RSI, plus we are in Q3 and within our long standing target range: 1970-2070. These negative divergences also appear in the DOW/NDX/NAZ. On the monthly charts we have the most overbought MACD in the history of the stock market, plus a double negative divergence in the RSI.
There are additional headwinds which can be considered more fundamental than technical. The FED’s QE 3 ends in October. The end of QE 1 and QE 2 coincided with market declines of 17% and 22% respectively. Europe has renewed deflationary pressures, as their inflation rate is currently 0.3%. The ECB and FED both target 2% inflation. The recent uptrend to new highs has occurred with some of the lowest volume this year. Traders are likely to start returning next week, as Labor Day marks the end of summer in most areas. Geopolitical events continue to flare up: ISIS in Iraq and Syria, Russia in the Ukraine. Both have the potential to create volatile markets, which usually occurs during steep corrections.
MEDIUM TERM: uptrend
The current Intermediate wave v uptrend started in early August at SPX 1905. Thus far the market has risen to all time new highs, as it hit 2005 this week. At the low there was a positive RSI divergence and an oversold MACD. Recently this uptrend looks more like Int. wave i, than Int. wave iii. That uptrend took only about four weeks: early February to early March. This uptrend will be about four weeks old next week.
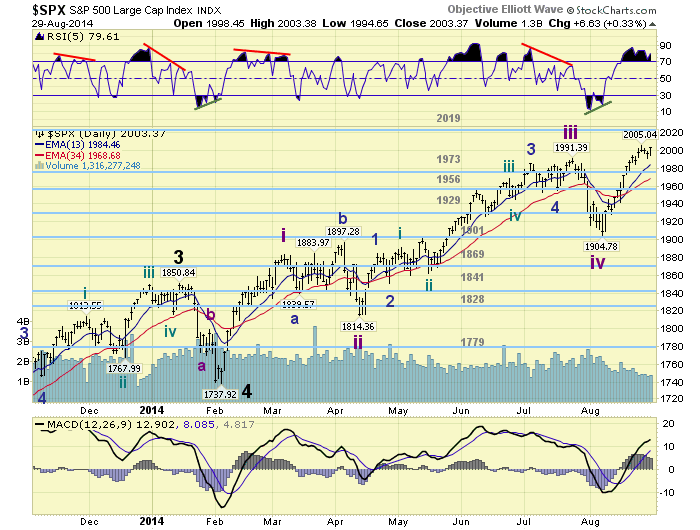
While the SPX/NDX/NAZ have all hit all time new highs, the DOW/NYA have been struggling to keep pace. The DOW did make a new high by just 2 points, while the NYA (new york composite index) has yet to do so. This suggests the advance is being driven by market leaders and growth stocks. The typical fifth wave narrowing of market participation. The DOW has also remained within its expanding triangle, limited by that upper trend line. Until we see a substantial rally breaking that upper trend line an extension of Primary wave III seems doubtful. Medium term support is at the 1973 and 1956 pivots, with resistance at the 2019 and 2070 pivots.

SHORT TERM
Short term support is at SPX 1985 and the 1973 pivot, with resistance at SPX 2005 and the 2019 pivot. Short term momentum ended the week overbought. The short term OEW charts turned positive with the reversal level now SPX 1998.
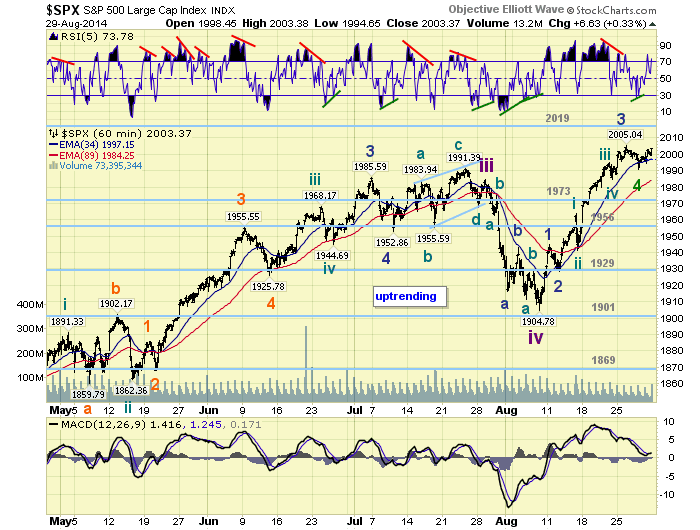
We have been counting this uptrend with five Minor waves. Minor waves 1 and 2 ended at SPX 1945 and 1928. Minor wave 3 divided into five Minute waves: 1964-1942-1995-1985-2005. Minor wave 4 appears to have ended on thursday at SPX 1991 with a positive short term divergence. During this bull market fifth waves have been somewhat limited: from less than the length of wave 1 to 1.618 times wave 1.
With wave 1 travelling 40 points (1905-1945) the upside limit for wave 5 would be about the OEW 2070 pivot. The minimum upside would be marginal new highs above SPX 2005. Assuming the short term count is correct, no Primary III extension, the uptrend target range is between these two numbers. Our next pivot is 2019, with a range of 7 points. Within this pivot are two fibonacci relationships: @ SPX 2014 Int. v = 0.618 Int. iii, and @ SPX 2016 Minor 5 = 0.618 Minor 1. With all the indices setting up for potential negative daily RSI divergences at higher highs, let’s see how these numbers work out next week.
FOREIGN MARKETS
Asian markets were mostly lower for a net loss of 0.5%.
European markets were all higher for a net gain of 1.8%.
The Commodity equity group were mixed for a net gain of 0.1%.
The DJ World index gained 0.6%.
COMMODITIES
Bonds continue to uptrend gaining 0.4%.
Crude is still downtrending, but gained 2.7%.
Gold remains in a downtrend but gained 0.5%.
The USD continues to uptrend and gained 0.4%.
NEXT WEEK
Tuesday: ISM manufacturing and Construction spending at 10am. Wednesday: Factory orders, Auto sales and the FED’s beige book. Thursday: ADP, weekly Jobless claims, the Trade deficit, ISM services, and a speech from FED governor Powell. Friday: Payrolls and the Unemployment rate. Best to your three day weekend and week!
CHARTS: http://stockcharts.com/public/1269446/tenpp
http://caldaroew.spaces.live.com
After about 40 years of investing in the markets one learns that the markets are constantly changing, not only in price, but in what drives the markets. In the 1960s, the Nifty Fifty were the leaders of the stock market. In the 1970s, stock selection using Technical Analysis was important, as the market stayed with a trading range for the entire decade. In the 1980s, the market finally broke out of it doldrums, as the DOW broke through 1100 in 1982, and launched the greatest bull market on record.
Sharing is an important aspect of a life. Over 100 people have joined our group, from all walks of life, covering twenty three countries across the globe. It's been the most fun I have ever had in the market. Sharing uncommon knowledge, with investors. In hope of aiding them in finding their financial independence.
Copyright © 2014 Tony Caldaro - All Rights Reserved Disclaimer: The above is a matter of opinion provided for general information purposes only and is not intended as investment advice. Information and analysis above are derived from sources and utilising methods believed to be reliable, but we cannot accept responsibility for any losses you may incur as a result of this analysis. Individuals should consult with their personal financial advisors.
Tony Caldaro Archive |
© 2005-2022 http://www.MarketOracle.co.uk - The Market Oracle is a FREE Daily Financial Markets Analysis & Forecasting online publication.