


A Look at the Coming 30-year Inflation Cycle
Economics / Inflation Aug 27, 2014 - 11:47 AM GMTBy: Clif_Droke

 The upcoming bottom of the 60-year cycle will drastically alter the U.S. economic landscape. The ending of the long-term disinflationary/deflationary undercurrent will soon give way to a new long-term cycle of re-inflation/inflation, bringing with it both challenges and opportunities.
As we begin a new 60-year cycle, the main challenge for the Federal Reserve will be to resist the temptation to stimulate the economy during periods of sub-par growth. The saying, "Old generals fight the old wars" applies here as the Fed has always had difficulty in discerning the dominant economic undercurrent.
For instance, from the 1980s onward, most Fed presidents have had an abnormal fear of inflation after the harrowing experience of the 1970s. Only in the years following the credit crash has the Fed concentrated on fighting deflation. After the unforgettable experience of 2008, it doesn't take much imagination to see the Fed fighting the specter of deflation for years to come, long after deflation ceases to be a threat.
If the Fed remains true to form we can probably expect to see a continued commitment to a fairly loose monetary policy in the first few years of the new 30-year inflationary cycle. The good news is that it will still likely be several years before significant inflationary pressures come to bear. In the years immediately ahead we should see an increasing volume of the excess cash on the sidelines returning to circulation. This will result in a gradual rise in inflation, though it shouldn't immediately result in runaway inflation. The second half of the 30-year cycle in the years 2030 through 2044 is when hyperinflation will likely become an issue.
The following graph is a stark reminder of the deflationary undercurrent of the last several years. It shows the velocity, i.e. turnover, of money in the U.S. economy.
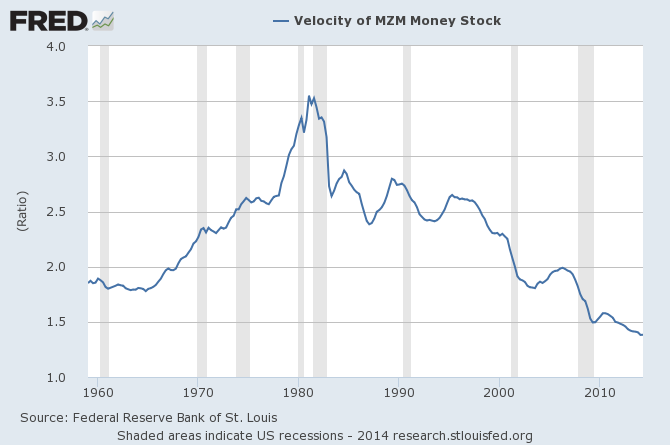
At some point the velocity of money will reverse its long-term decline as confidence increases and investors realize that the threat of deflation has disappeared. Will the hundreds of billions in sidelined money enter the economy as a slow, gradual trickle? Or will it re-enter the channels of commerce quickly as a mighty onrushing torrent? Since no one can definitively answer this question, the wisest policy would be for the Fed to resist the temptation to employ money printing schemes as a palliative for boosting the economy, especially as this will be unnecessary in the years ahead.
In his March 11, 2009 "Special Edition VII" entitled, "Terminal Opportunity 2009," Samuel J. Kress described the 60-year cycle as the primary bias or "Super Cycle," with the 30-year cycle being the half-component of the 60-year cycle, also known as the secondary bias cycle. Kress wrote:
"The 60-year [cycle] correlates to the average duration of the underlying economic 'super cycle' which ranges from 40-80 years. This cycle was identified in the early 1900s by a Russian economist, Nikolai Kondratieff, which tracks wholesale commodity prices, and being void of any value added, it represents real demand in the economy. Additionally, it indicates the boom/bust phase of the credit/debt cycle. Being variable in duration, it is more appropriately referred to as the K Wave. It includes four (completeness) economic seasons: spring, summer, fall, winter." [Special Edition VII, Terminal Opportunity 2009, p. 2]
The chart example labeled "60 Year Super Cycle" is an illustration from a past Kress Special Edition and delineates the phases of the 60-year cycle. It is broken down into four 15-year segments which are known as economic "seasons." The following graph correlates each season to its appropriate inflationary or deflationary aspect over the previous 60-year period from 1954 through 2014.
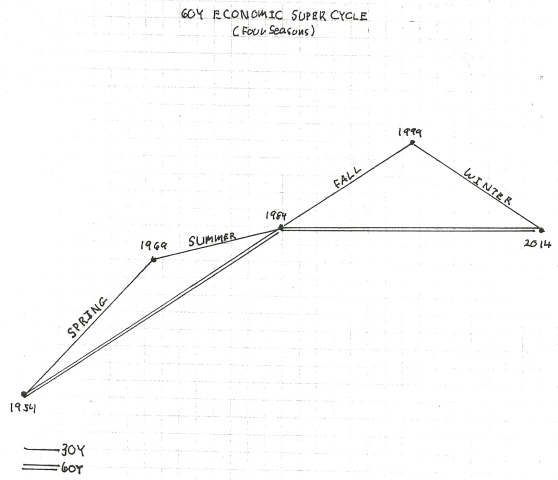
The first 15-year segment of the 60-year cycle is characterized by re-inflation; the second 15 years typically sees increasing inflation or even hyperinflation. The next 15-year segment sees disinflation or early deflation, and the last 15-year segment is the deflationary phase. Each 15-year segment of the 60-year cycle is assigned a "season," e.g. winter, spring, summer, fall.
Is it possible that the years immediately ahead could see above-average inflation? The answer is yes, but only if there's an unusual dynamic in place. An example of an unusual dynamic would be the outbreak of a major war. War is always inflationary for commodity prices and would only serve to heat up the economy faster than the new 30-year inflationary cycle would do on its own.
Following the 60-year cycle bottom of 1774, for example, inflation was a major problem in the colonies during the U.S. Revolutionary war in 1777-79. At that time a pound of butter cost $12 a pound while flour fetched nearly $1,600 per barrel in Revolutionary Massachusetts. Keep in mind this was only 3-5 years after the long-term Kress cycle bottomed. Jason Zweig observed that inflation was also a major problem during the U.S. Civil War. During the war years in the early-to-mid 1860s, "inflation raged at annual rates of 29% (in the North) and nearly 200% (in the Confederacy)," he writes. He also points out that immediately following World War II, inflation hit 18.1% in the U.S.
Turning our attention to the stock market, many analysts have taken up the theme that another major correction or even a crash is just around the corner. The thinking behind this is that the stock market rally of the last five years artificially induced through the Fed's monetary stimulus. Under the bears' theory, once QE completely ends the markets will experience a major re-valuation and a return to a "normal" price level.
In response to this scenario, an observation can be made that the market is already back to "normal." Consider that equities, which desperately wanted to rally in the years between 2004 and 2007, were held back from realizing their full potential by the tight Fed policy of the time. The Fed's interest rate policy of 2004-2007 did the economy no favors and was one of the catalysts behind the credit crash of 2008. When finally the Fed got its investment rate policy back in alignment with the long-term cycle, the market quickly returned to its proper level as the economy recovered.
Consider, too, that we've come through a tumultuous 15-year period which saw two major bear markets, the constant threat of terrorism, a two-front multi-year war, and the near-collapse of the U.S. economy. The years between 2000 and 2014 can therefore be described as an elongated "correction" in the super long-term uptrend in America's progress. A few years ago there was a question as to whether or not the economy would survive the upcoming 60-year cycle bottom. With hindsight it's now obvious that the last 15 years of the cycle - the deflationary phase - was cleansing and restorative rather than ultimately destructive.
There is every reason for believing the next few years of the new 60-year cycle will be as salutary to the economy as the previous 15 years were depressive. A new economic spring season will soon follow the economic winter of the last several years. With the coming of long-wave spring we should see increasing signs that the economy is returning to a normal, healthy rate of growth. The fear and uncertainty that were prevalent in the last 15 years will gradually subside and be replaced by rising confidence as investors and businesses take more chances and spend more money into circulation. The rising tide of long-wave spring will lift all boats as a greater segment of America's social classes begin to experience an economic rebound from the depressing years of the winter season.
At long last, it's time to bid the 15-year economic winter adieu and welcome the onset of
Kress Cycles
Cycle analysis is essential to successful long-term financial planning. While stock selection begins with fundamental analysis and technical analysis is crucial for short-term market timing, cycles provide the context for the market’s intermediate- and longer-term trends.
While cycles are important, having the right set of cycles is absolutely critical to an investor’s success. They can make all the difference between a winning year and a losing one. One of the best cycle methods for capturing stock market turning points is the set of weekly and yearly rhythms known as the Kress cycles. This series of weekly cycles has been used with excellent long-term results for over 20 years after having been perfected by the late Samuel J. Kress.
In my latest book “Kress Cycles,” the third and final installment in the series, I explain the weekly cycles which are paramount to understanding Kress cycle methodology. Never before have the weekly cycles been revealed which Mr. Kress himself used to great effect in trading the SPX and OEX. If you have ever wanted to learn the Kress cycles in their entirety, now is your chance. The book is now available for sale at:
http://www.clifdroke.com/books/kresscycles.html
Order today to receive your autographed copy along with a free booklet on the best strategies for momentum trading. Also receive a FREE 1-month trial subscription to the Momentum Strategies Report newsletter.
By Clif Droke
www.clifdroke.com
Clif Droke is the editor of the daily Gold & Silver Stock Report. Published daily since 2002, the report provides forecasts and analysis of the leading gold, silver, uranium and energy stocks from a short-term technical standpoint. He is also the author of numerous books, including 'How to Read Chart Patterns for Greater Profits.' For more information visit www.clifdroke.com
Clif Droke Archive |
© 2005-2022 http://www.MarketOracle.co.uk - The Market Oracle is a FREE Daily Financial Markets Analysis & Forecasting online publication.