


Stock Market Bear Tracks Abound In Wall Street
Stock-Markets / Stocks Bear Market Aug 26, 2014 - 05:50 PM GMTBy: I_M_Vronsky

 Today's boundless investor complacency is eerily reminiscent of the unbridled investor euphoria of the roaring 1920’s. And all avid market students remember what happened then…i.e. the 1929 Stock Market Crash.
Pervasive investor complacency reigns in Wall Street today…similar to what caused myopic prudence in 2000-2001 and again 2007-2008. It is imperative to recall that in each case stock indices lost more than 50% of their value.
Indeed bear tracks were evident in those two corrective periods. However, investors were too apathetically involved to worry about the increasing signs of bear tracks on Wall Street. And of course the typical broker was characteristically (and conveniently) immune to the telltale signs of an approaching correction to grossly over-valued stocks. And rest assured that the ‘DON’T WORRY…BE HAPPY’ theme is the dangerous cavalier investor attitude that prevails today in Wall Street…AND MAIN STREET U.S.A.
Reviewed below are Today’s Visible Bear Tracks In Wall Street
US stocks are in a Screaming SELL ZONE
There is a heretofore infallible indicator that signals the topping of the DOW Index. This indicator is the ratio of US-Treasuries/DOW Index.
In 2000 and again on 2007 it clearly pinpointed the DOW Index topping. Below is the chart of the Dow Index super-imposed on the US-Treasuries/DOW Index Ratio. It is imperative to carefully notice when the US-Treasuries/DOW Index Ratio bottoms (ie pink ball at chart bottom), it is heralding the peaking of the DOW Index (purple curve). It happened in 2000 and 2007. NOW again the US-Treasuries/DOW Index Ratio has given a SELL SIGNAL FOR US STOCKS (ie DOW Index).
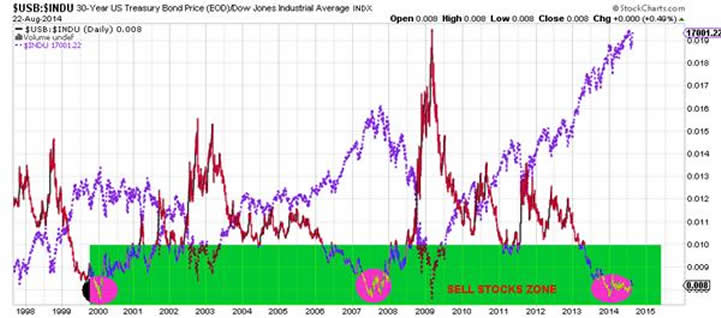
Needless to say the US stock bull is indeed long in the tooth.
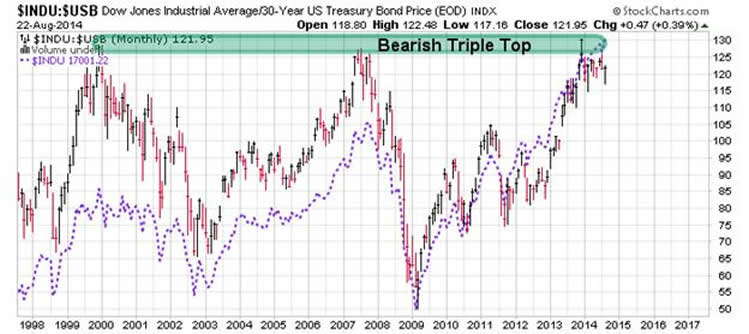
Triple Top Death Knell is an ominous omen for US stocks
Bears Watching: An ominous bearish Triple Top has formed in Dow/T-Bond ratio:
In early 2000 the Dow/T-Bond ratio peaked, triggering the beginning of a bear market in Wall Street stocks...that lasted more than two years.
Again in mid-2007 the Dow/T-Bond ratio peaked, which was open door rampage of a devastating bear market in stocks where the Dow lost about -54%. This bear market lasted 20 months.
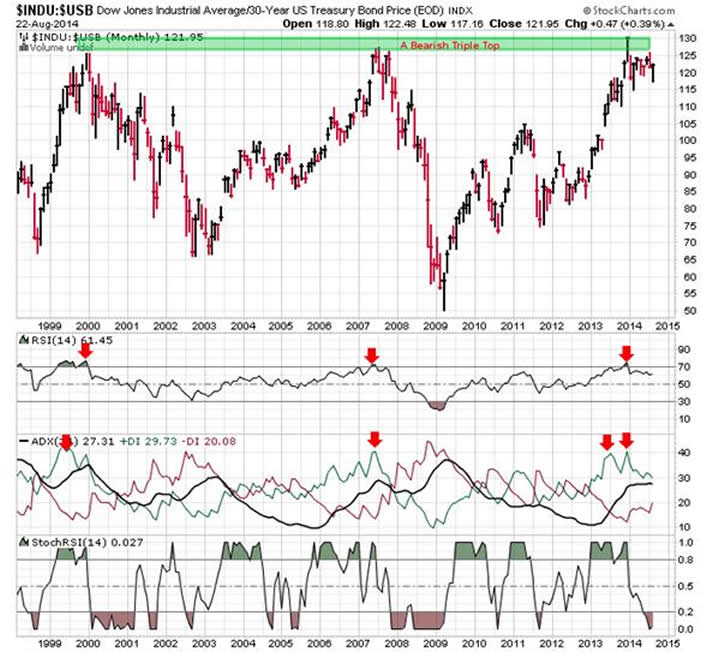
Another view of the bearish triple top forecasts stocks should tank in 2014:
The monthly graph shows the DOW Index (purple) super-imposed on the DOW/US T-Bond ratio. Notice how the DOW/US. T-Bond ratio peaked in early 2000 and again in mid-2007, which led to horrific declines in stocks (i.e. Dow Index et al).
Also notice DOW/US T-Bond ratio peaked yet again in January this year, which signals a probable stock market crash looming on the horizon.
And in the event the impending stocks crash replicates the 2000-2003 and 2007-2008 crashes, then US stocks may well be hammered down approximately 50 percent during the next 18-24 months.
The above may influence the US Fed's tapering policies.
FAST-FORWARD early February 2014: Yet again the Dow/T-Bond ratio has peaked. Moreover, all the Technical Analysis indicators are red negative -- as they were in 2000 and in 2007.
This begs the question: When are the big bad bears going to storm out of their lairs?
No one knows with absolute certainty, but IMHO it is ludicrous to be long Wall Street stocks in this environment.
AND THERE'S A Bearish Triple Top in the FTSE Stock Index:
Stock market historians will recall it was the British FTSE Stock Index that heralded the start of the 1929 Great Crash.
Interestingly, the FTSE has recently formed an intriguing (albeit bearish) triple top. Here's what happened when the FTSE peaked in 2000 and again in 2007.
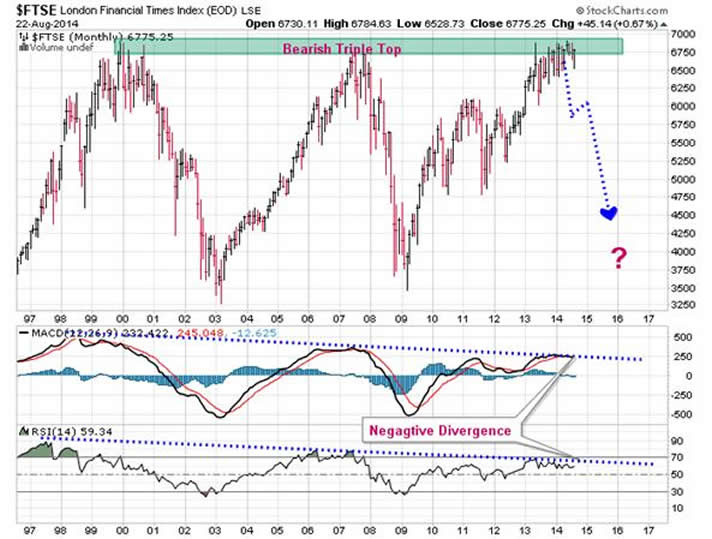
From its 2000 peak, the FTSE was hammered down -52% in the next 38 months. From its 2007 peak, the FTSE was hammered down -48% in the next 15 months.
Bears Watching (pardon the pun)
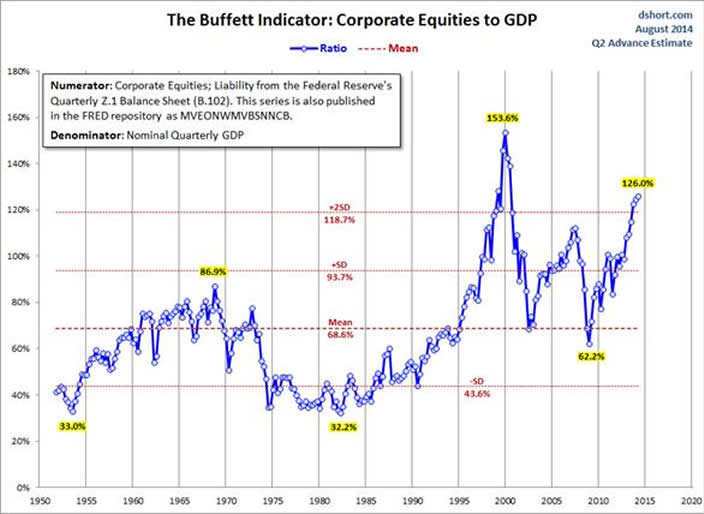
Billionaire Warren Buffett's Valuation Metric indicates a Stock Bubble is forming
Market cap to GDP is a long-term valuation indicator that has become popular in recent years, thanks to Warren Buffett. Back in 2001 he remarked in a Fortune Magazine interview that "it is probably the best single measure of where valuations stand at any given moment."
The four valuation indicators I track in my monthly valuation overview offer a long-term perspective of well over a century. The raw data for the "Buffett indicator" only goes back as far as the middle of the 20th century. Quarterly GDP dates from 1947, and the Fed's B.102 Balance sheet has quarterly updates beginning in Q4 1951. With an acknowledgement of this abbreviated timeframe, let's take a look at the plain vanilla quarterly ratio with no effort to interpolate monthly data or extrapolate since the end of the most recent quarterly numbers.
The strange numerator in the chart title, MVEONWMVBSNNCB, is the FRED designation for Line 36 in the B.102 balance sheet (Market Value of Equities Outstanding), available on the Federal Reserve website. Here is a link to a FRED version of the chart. Incidentally, the numerator is the same series used for a simple calculation of the Q Ratio valuation indicator.
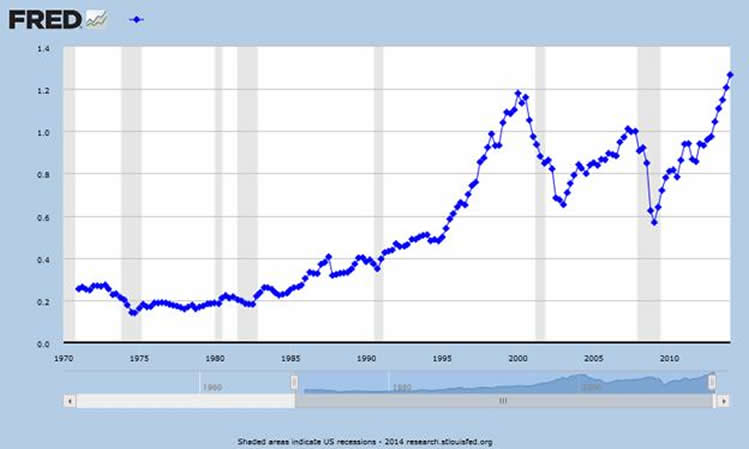
Wilshire 5000 Index/GDP
What Do These Charts Tell Us?
Both the "Buffett Index" and the Wilshire 5000/GDP variant suggest that today's market is indeed at lofty valuations, now above the housing-bubble peak in 2007. In fact, the more timely of the two (Wilshire / GDP) has risen for eight consecutive quarters and is now approaching two standard deviations above its mean -- a level exceeded for six quarters during the dot.com bubble. MOREOVER, a tell-tale sign of what Warren Buffett thinks of today’s stocks over-valuation is the fact that his flagship company (Berkshire Hathaway) has more than $55 Billion in cash (the highest level in the company’s existence).
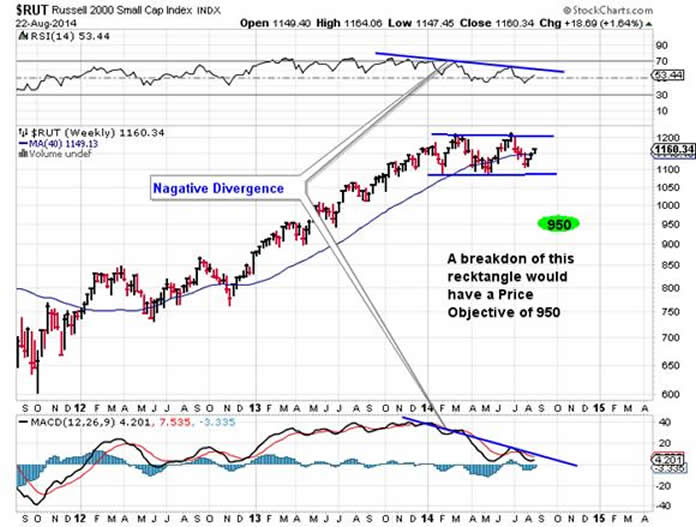
Russell 2000 Index looks to fall with a breakdown of this double top rectangle – as RSI and MACD show bearish negative divergence since the beginning of the year.
Bears Watching....literally !
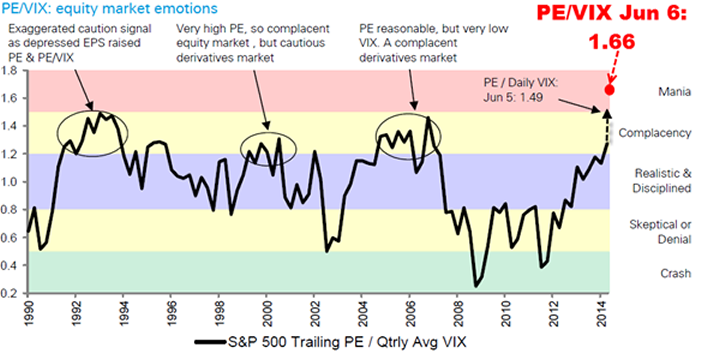
S&P500 ratio/VIX is heralding a market crash....take careful notice of this in 2000 and 2007, which signaled sell signals for stocks.
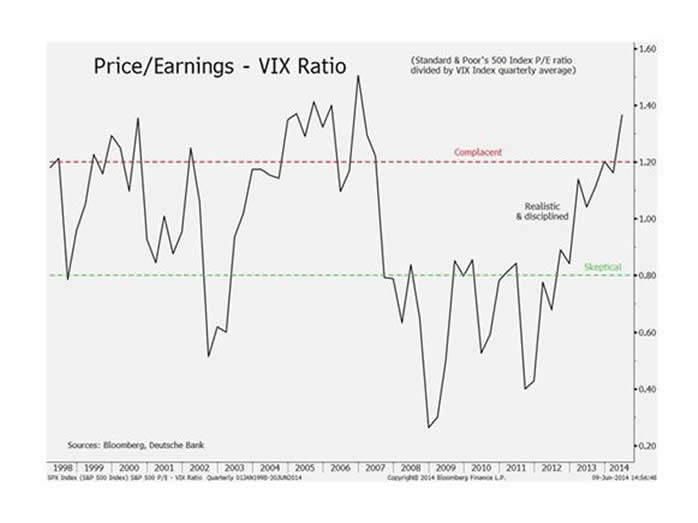
IT IS CRUCIAL to notice we have the exact same topping level today, which means stocks may soon crash.
The ratio of the S&P500/VIX (Volatility Index) rose to peaks in 2001 and 2007 and now again in 2014.
And here’s what the bear market wrought in US stocks:
2001…………………down -50% 2007…………………down -56%
Based upon S&P500/VIX (Volatility Index) peaking in the past, followed by horrific stock corrections; and that the current S&P500/VIX ratio is right at an all-time record high, one may assume U.S. stocks are hell bent for leather to suffer a possible bear market plunge of possibly -50% in the not too distant future.
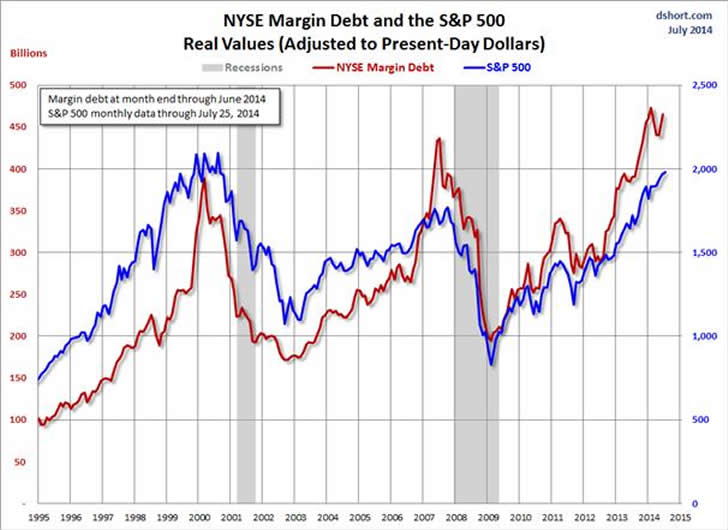
Margin debt balances of the NYSE & S&P500 are at all-time record highs.
When margin debt balances peaked in 2000 and again in 2007, bear markets ensued where stocks were hammered down more than 50%. Rest assured this time will not be different.
These irrefutable bear Tracks are strongly suggesting that the current stock investment complacency will soon morph into panicked stock selling frenzy.
By I. M. Vronsky
Editor & Partner - Gold-Eagle
www.gold-eagle.com
Founder of GOLD-EAGLE in January 1997. Vronsky has over 40 years’ experience in the international investment world, having cut his financial teeth in Wall Street as a Financial Analyst with White Weld. He believes gold and silver will soon be recognized as legal tender in all 50 US states (Utah and Arizona having already passed laws to that effect). Vronsky speaks three languages with indifference: English, Spanish and Brazilian Portuguese. His education includes university degrees in Engineering, Liberal Arts and an MBA in International Business Administration – qualifying as Phi Beta Kappa for high scholastic achievement in all three.
© 2014 Copyright I. M. Vronsky - All Rights Reserved
Disclaimer: The above is a matter of opinion provided for general information purposes only and is not intended as investment advice. Information and analysis above are derived from sources and utilising methods believed to be reliable, but we cannot accept responsibility for any losses you may incur as a result of this analysis. Individuals should consult with their personal financial advisors.
© 2005-2022 http://www.MarketOracle.co.uk - The Market Oracle is a FREE Daily Financial Markets Analysis & Forecasting online publication.