Gold Price Manipulation Still Alive
Commodities / Gold and Silver 2014 Aug 25, 2014 - 02:52 AM GMTBy: Toby_Connor
 If one looks at a longer term chart of the last two years it’s very clear that gold is being capped at certain levels, and those levels are slowly forcing gold lower and lower. Each one of these manipulation zones are being defended successfully and that has some serious connotations going forward.
This all started right after the announcement of QE3. Gold was driven below $1700 and held below that level for 2 months. This got the ball rolling so to speak, it broke an intermediate cycle and started the bear market. Of course we all remember the call by GS to sell gold short followed by the premarket attack on April 12 that took out the stops below $1520 leading to a waterfall decline. That had to be one of the most blatant cases of manipulation in market history.
Without a doubt gold completed a final ICL (intermediate cycle low) on Apr. 16. The May retest was the beginning of what should have been a recovery from the manipulation and a resumption of the secular trend.
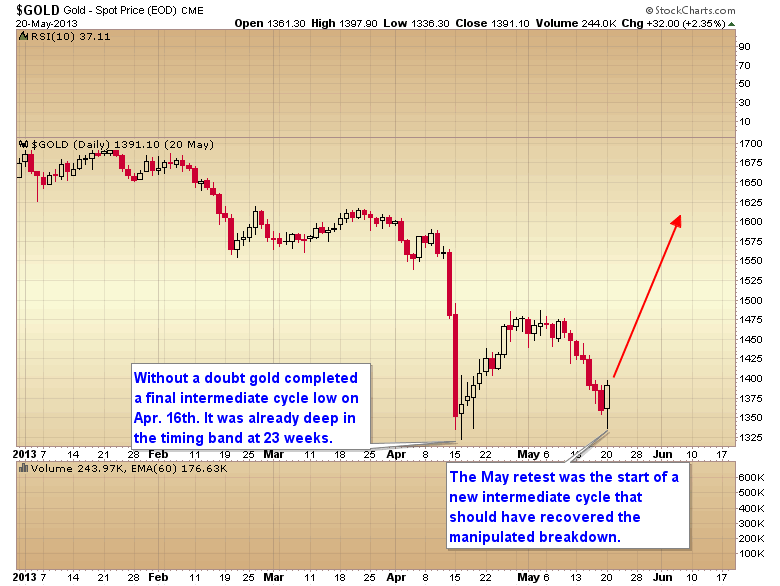
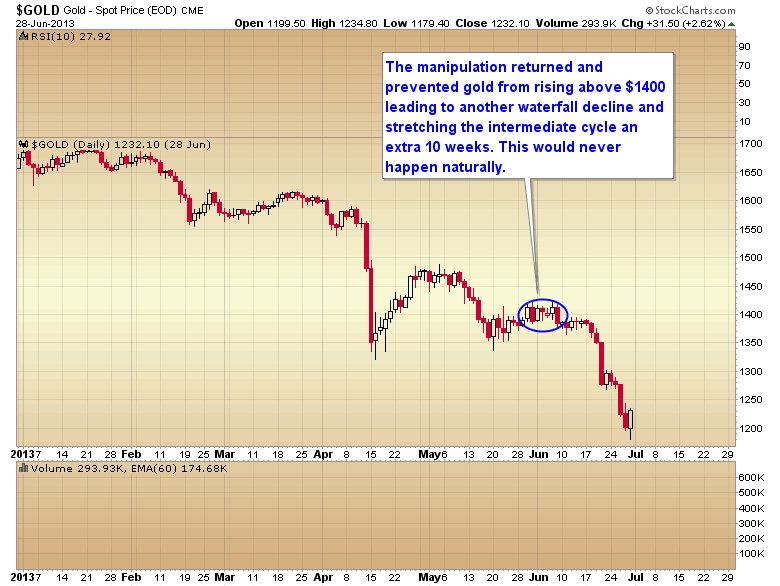
But then something happened. As gold tried to rise above $1400 we saw repeated attacks to keep gold below that level eventually leading to another waterfall decline in June down to $1179. In the process this created a 33 week intermediate cycle - a full 10 weeks longer than normal.
The natural ICL occurred on week 23 at the April bottom. The manipulation to prevent a new intermediate rally above $1400 added a full 10 weeks to the cycle.
And let me say that having observed these cycles for over 10 years I can say without a doubt that a failed intermediate cycle in decline never stretches an extra 10 weeks. Most of the time they bottom a bit prematurely as the selling pressure tends to exhaust itself quickly.
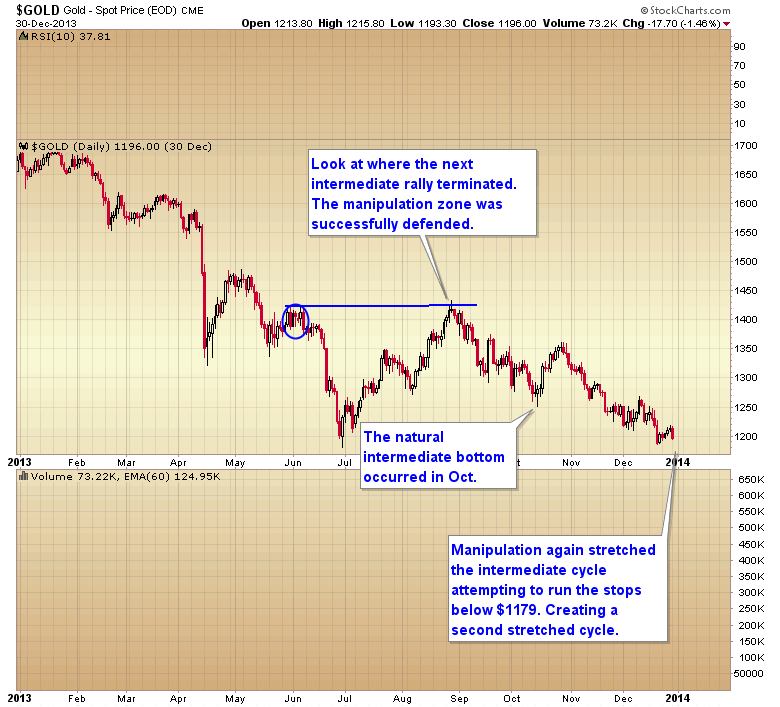
So a manipulation zone had been established between $1400 and $1430. The next intermediate rally out of the June bottom was capped right at that $1430 level. The zone had been successfully defended. This then led to another stretched intermediate cycle. Again having watched these cycles for years I can say without a doubt that two stretched and declining cycles in a row isn't a naturally occurring event. The powers that had created this bear market were trying to run the stops below $1179 and in the process they stretched a second intermediate cycle.
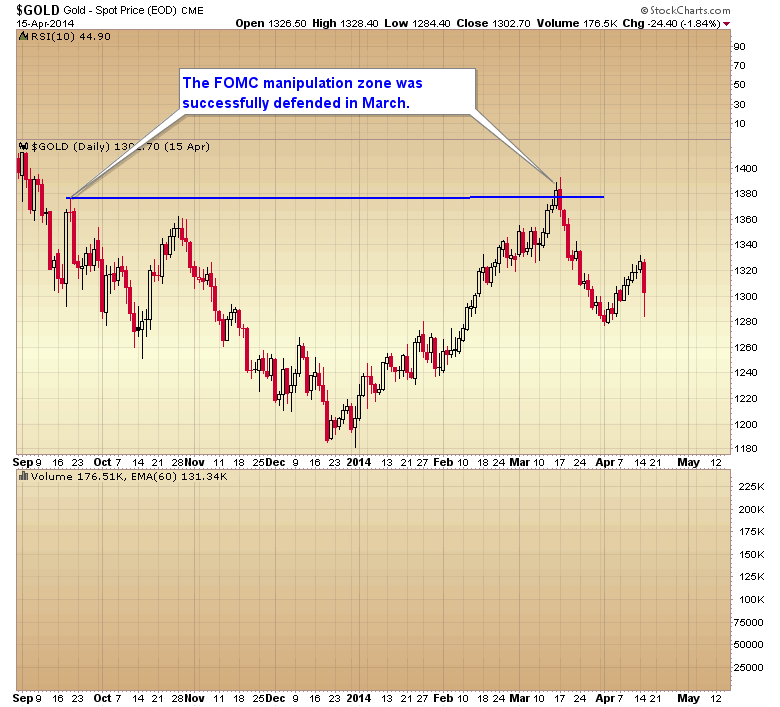
The next blatant manipulation of the gold market occurred right after the September FOMC meeting. Gold was immediately taken down the very next day creating a daily cycle that topped on day 1. Never in history has a gold daily cycled topped on day 1.
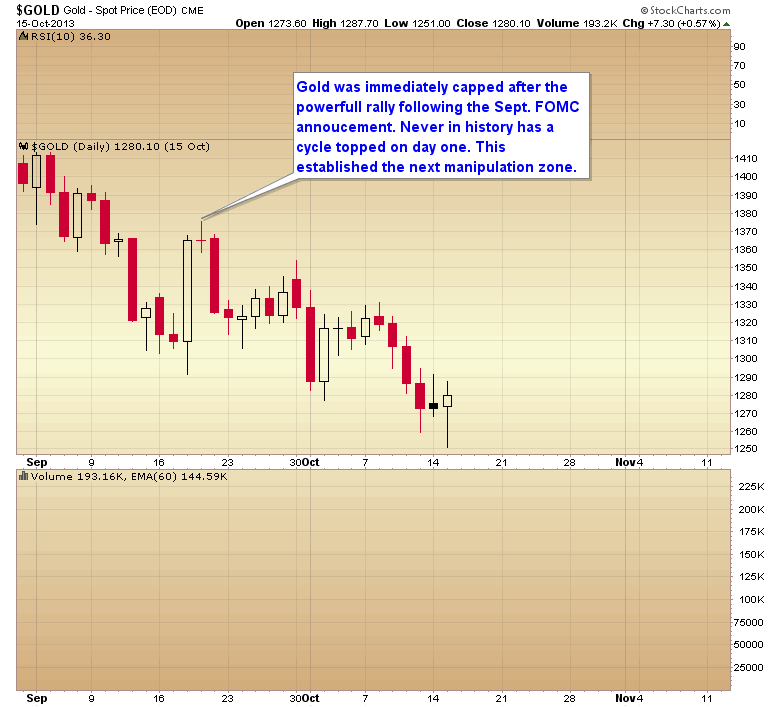
This established another manipulation zone at $1375. The intermediate rally out of the Dec. 31 bottom poked above that $1375 level for 1 day before it was turned back down. Another manipulation level was being successfully defended.
We now we have another manipulation zone that has formed at the top of the recognition day on July 19 at $1320. Other than just a few days above that level the zone has been defended and it has now broken the intermediate cycle.
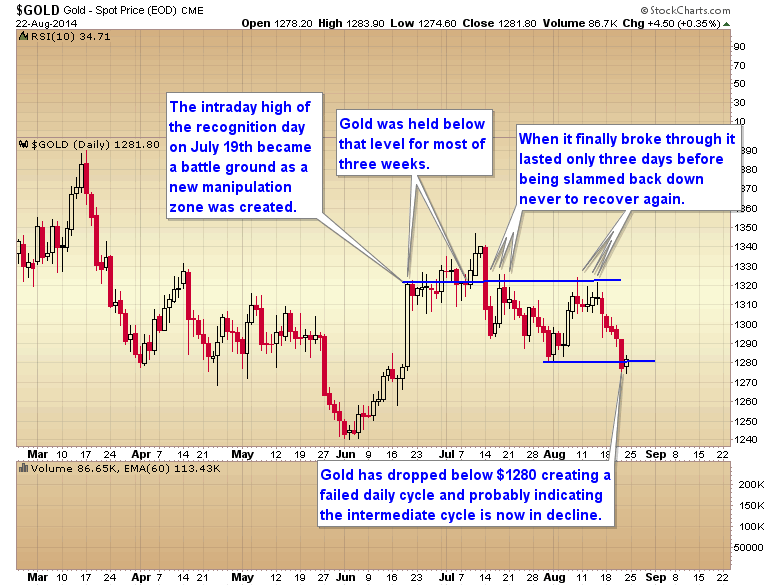
What is concerning is that every one of these manipulation zones are being successfully defended when challenged. That would suggest that the next intermediate rally is unlikely to get above $1320 for more than a day or two before it too is turned back.
goldAt this point it has become painfully obvious that once a manipulation zone is established the powers in the paper market can defended them, and each one of these zones are occurring at lower and lower levels.
I think traders need to recognize this fact and adjust their trading accordingly. One can only go long the sector at an intermediate cycle bottom, and once that rally approaches a manipulation zone get out and stay out until the next intermediate bottom. As this pertains to the gold market right now it would suggest that we aren't likely to see $1320 recovered quickly.
I honestly don’t know what it is going to take to break this pattern in the gold market. If two ongoing wars isn't enough to drive gold through the $1320 suppression zone who knows what kind of black swan event will have to occur to trigger a resumption of the secular trend.
For now I have locked up our gains in the metals and I'm going to continue to sit on the sidelines until gold gets into the timing band for the next intermediate bottom, and that isn’t due for another 7-12 weeks.
If we see a manipulation zone challenged and broken, that will be our clue that gold is ready to trade freely again. As of right now that would mean a sustained move above $1320. If that were to occur that would get me off the couch and back into the market. If not, then I will wait patiently for the next buying opportunity in 2-3 months.
So far the SMT has made good money buying these intermediate bottoms and exiting when gold pushes into a manipulation zone. But until the manipulation has been broken, a buy and hold strategy is no longer an option as each one of these zones is occurring at lower and lower levels as the powers in the paper market try to keep the bear market alive.
Toby Connor
Gold Scents
GoldScents is a financial blog focused on the analysis of the stock market and the secular gold bull market. Subscriptions to the premium service includes a daily and weekend market update emailed to subscribers. If you would like to be added to the email list that receives notice of new posts to GoldScents, or have questions,email Toby.
© 2014 Copyright Toby Connor - All Rights Reserved
Disclaimer: The above is a matter of opinion provided for general information purposes only and is not intended as investment advice. Information and analysis above are derived from sources and utilising methods believed to be reliable, but we cannot accept responsibility for any losses you may incur as a result of this analysis. Individuals should consult with their personal financial advisors.
© 2005-2022 http://www.MarketOracle.co.uk - The Market Oracle is a FREE Daily Financial Markets Analysis & Forecasting online publication.


