Stock Market New Highs Less Certain
Stock-Markets / Stock Markets 2014 Aug 18, 2014 - 04:56 PM GMTBy: Andre_Gratian
 Current Position of the Market
SPX: Very Long-term trend - The very-long-term cycles are in their down phases, and if they make their lows when expected, there will be another steep decline into late 2014. However, the Fed policy of keeping interest rates low has severely curtailed the full downward pressure potential of the 40-yr and 120-yr cycles.
Intermediate trend - Correction appears to be over.
Analysis of the short-term trend is done on a daily basis with the help of hourly charts. It is an important adjunct to the analysis of daily and weekly charts which discusses the course of longer market trends.
NEW HIGH LESS THAN CERTAIN
Market Overview
Once again, I will start by quoting from last week's Summary:
"It is clear that the geopolitical situation is heating up all over the world. What were before mostly small skirmishes by terrorist groups have escalated into full-fledged conflicts in various regions. This may be the beginning of a new trend: a "cycle of violence" (a part of which is the fight against Ebola) which will grow in intensity before it subsides."
On Friday, a powerful rally by the stock market was substantially scaled back by news that Ukrainian forces had destroyed a Russian armed column which had crossed into their territory overnight. For now, at least, it did not seem to have further repercussions and the market seemed to sense this, and recovered part of its loss. What - and when - will it be next time? We might keep in mind 8/25 since the famous market astrologer Merriman is foreseeing some potential trouble around that date.
I had also mentioned that some unforeseen economic repercussions could result from the geopolitical situation. In fact, the sanctions imposed on Russia, and retaliation by Putin are already threatening to hurt not only the Russian economy, but the fledging EU recovery as well. If the market starts to seriously worry about this, the anticipated top could come sooner than generally expected.
Technically, it could be said that the SPX was pushed back by an overbought condition which tried, but failed to penetrate the substantial resistance which lies overhead. Friday's action could mean that more consolidation will be needed before another attempt at extending the rally is made. By being pushed back to where it was, SPX failed to fully confirm that it had reversed its short-term downtrend.
Chart Analysis
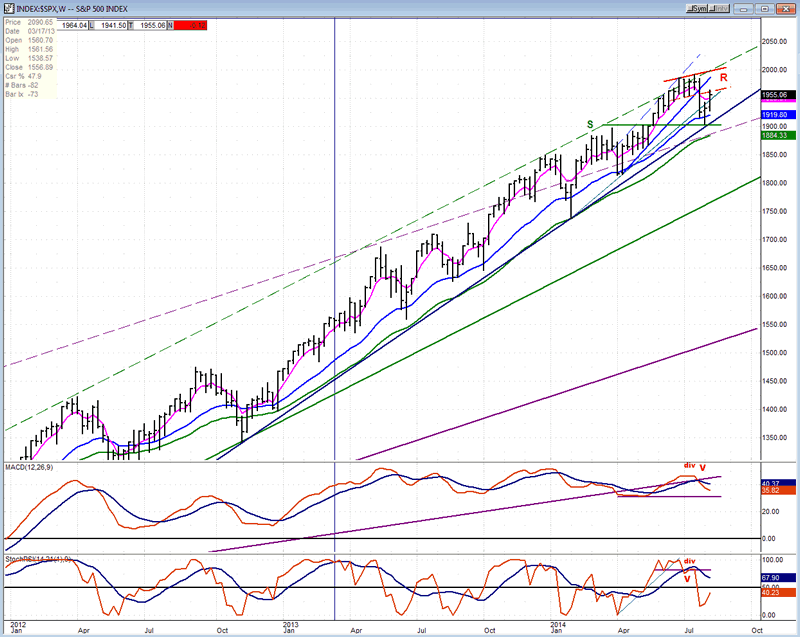
Another peek at the weekly SPX chart is in order (courtesy of QCharts.com, including the subsequent two charts).
Strong upside momentum such as that exhibited by the SPX does not dissipate quickly! A number of times before, it looked as if the index was beginning to roll over, but after a small consolidation it went on to make a new high. Can we expect the same behavior this time? It will depend on the index's ability to penetrate the overhead resistance formed by the recent top before it breaks the trend line which arrested its decline. It's really as simple as to which comes first.
The weekly oscillators are still in a downtrend and the MACD is beginning to show some serious divergence to the price. On the last uptrend, it was not able to exceed or even match the new high in price. Also, it has broken its long-term trend line for the second time. This trend line goes back to the beginning of the bull market in 2009 and a downward turn in the weekly MACD is a red flag which should not be ignored
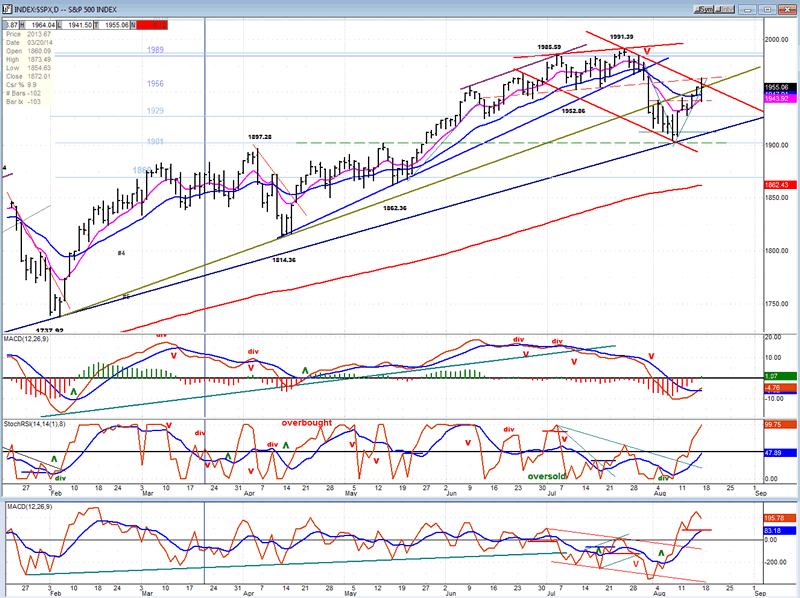
What about the daily chart? What does it say? The corrective channel that is drawn is arbitrary, but it's fair to say that, with Friday's pull-back, the SPX has not achieved a decisive break-out from it. Nor did it overcome the former broken trend line, so it would make sense for some additional consolidation to take place before another attempt is made at a break-out.
Instead of using a horizontal line to represent the bottom of the overhead resistance which also contributed to stopping the advance, I drew a line across the two tops and a parallel across the lows. You can see that the rally stopped exactly at the extension of that line. Even if the index pulls back from this level, that's probably all that it will do before trying to move up again. More than likely an end of the short-term correction came in at the 1905 projection. The two lower indicators are in a strong uptrend and they seldom, if ever, retrace immediately from such a pattern which normally marks the beginning of an uptrend in price. As usual, the MACD, which is always playing catch-up, is just starting a bullish cross. However, another failure to go higher could have more negative consequences.
What will most likely follow is something similar to what we had after the April low; not the kind of momentum displayed in February -- but only its first phase without the strong extension which started in mid-May. As stated above, whatever we do from this point on, we will know when we have made an important top when the trend line which stopped the decline this time finally gives way.
The hourly chart is next!
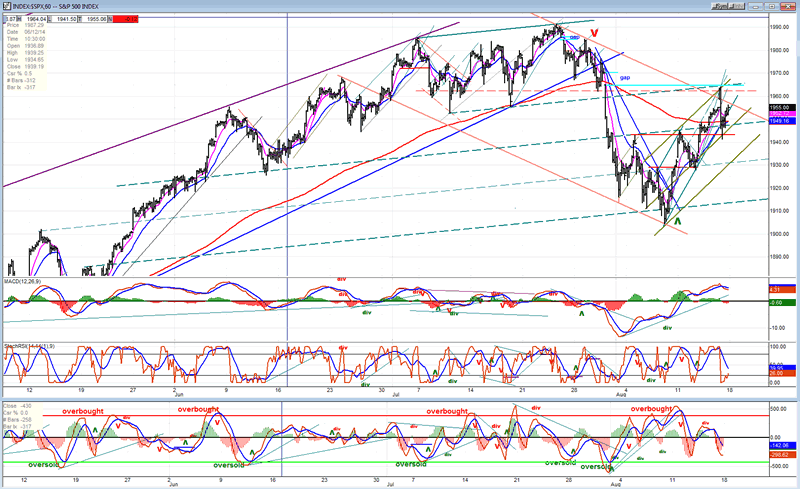
I have discussed before the immense value of parallel trend lines in determining support and resistance levels. This is exemplified on the chart by the green dashed lines which are all parallel to the solid line drawn across the two tops. In this case, the parallels served to identify precisely the bottom of the correction, the mid-point of the current rally, and its top. The exactness is nothing short of amazing. If we do correct from where we closed on Friday, the retracement point may well be the level of the second parallel from the bottom, especially since it corresponds to the new channel being described by prices.
In addition to finding resistance at the first parallel from the top (and the top line of the channel which I consider valid) note that the rally stopped precisely at the bottom of the gap which occurred when the decline started in earnest. This is often the case!
The A/D oscillator (bottom) also signaled an interruption in the rally by showing ample negative divergence as did the MACD (by its deceleration pattern). All oscillators are still in a declining mode and it would make sense for one more pull-back to take place, especially since that would form an a-b-c pattern in the pull-back.
Cycles
The 11-calendar day cycle top is due on Monday (but may have come on Friday). There is also a 21-day cycle high due on Monday. The 9-td high is due on Friday.
Clif Droke, who was a friend of Bud Kress, and is the best interpreter of the Kress cycles, recently mentioned that the 10-wk cycle had just peaked, which could be a deterrent to the SPX's ability to make a new high before turning down. EW analysts are looking for a new high before a correction takes place. We'll see!
Breadth
The McClellan Oscillator and the Summation Index appear below (courtesy of StockCharts.com).
The McClellan Oscillator had a sharp rally which took it to the level where it normally pauses and consolidates. If it should stop there instead of pushing higher it would be a sign that the rally will be limited. To some extent, this may already have been indicated by the fact that it dropped below the green line on its recent low.
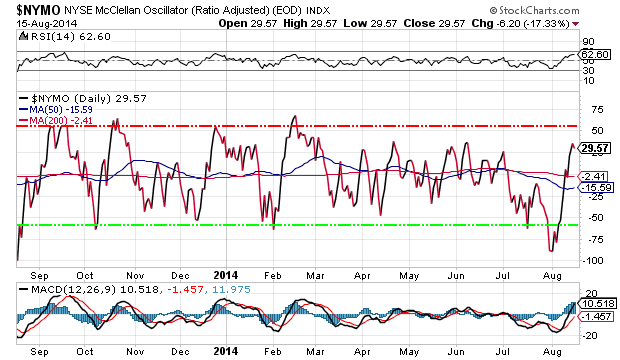
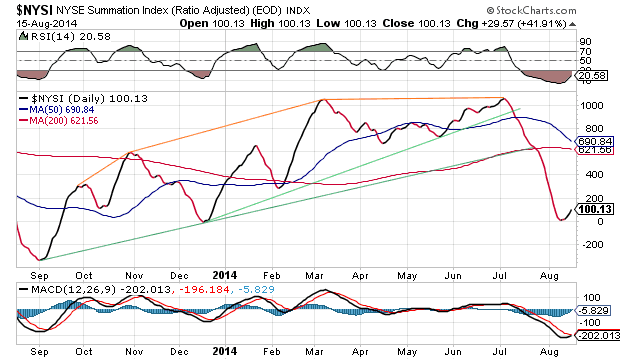
The summation index has just begun to turn up, but its RSI is still oversold. That could be an indication that more of a rally will take place.
Sentiment Indicators
The SentimenTrader (courtesy of same) long term indicator remains at 50.

VIX (CBOE volatility Index)
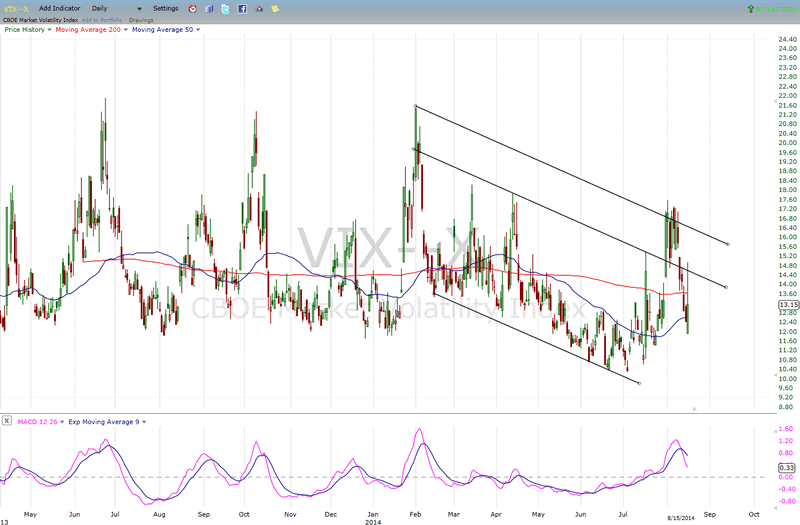
VIX's attempt at breaking out of its short-term downtrend failed at the top of its corrective channel line. The pull-back found good support from the previously established base. If VIX can consolidate in this area and start up again, it may have a chance to break through. However, since this would mean that the market is making a new low, the possibility is suspect. More likely, VIX will continue to consolidate in the established range in preparation for a break-out later.
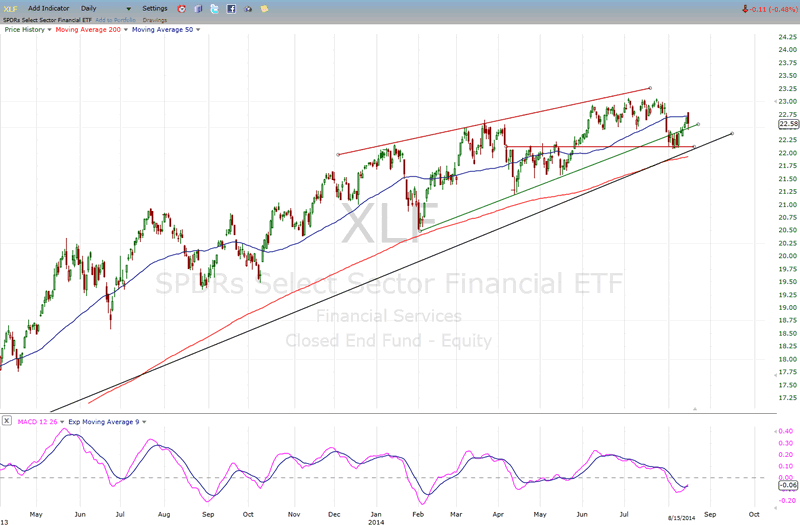
XLF (financial ETF)
XLF is caught between support and resistance and may remain in this predicament until the market decides in which direction to break.
TLT (20+yr Treasury Bond Fund)
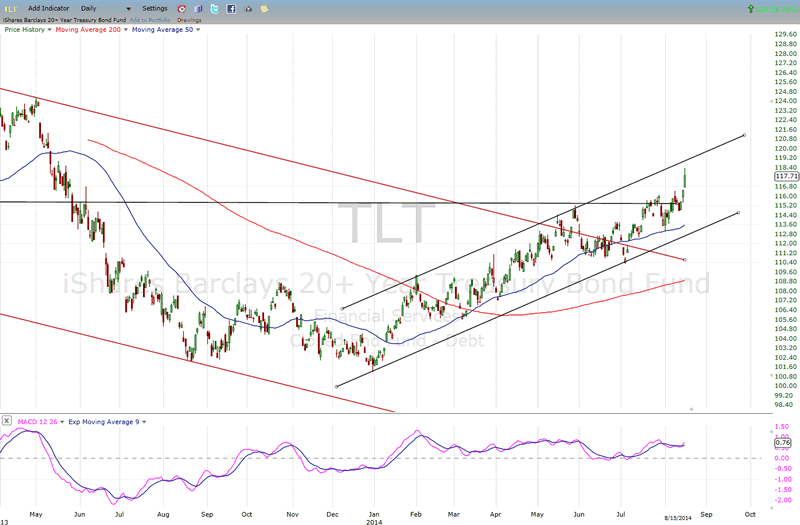
TLT took advantage of the news from Ukraine to push beyond its resistance level to a new rally high. However, this puts it near the top of its channel where it should find some additional resistance. Breaking through the top of the channel would be very bullish.
GLD (ETF for gold)
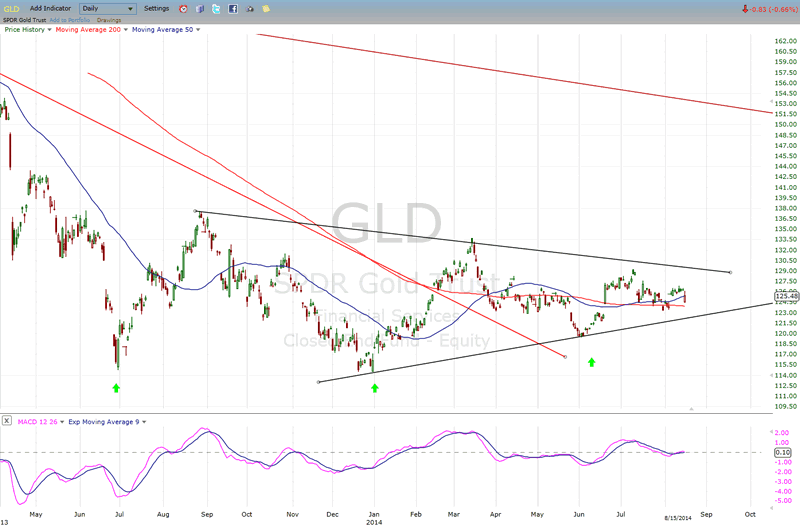
It looks like the last little push upward by GLD was only a false alarm. It is now falling back toward its 200-DMA. The lines of demarcation between bullish and bearish behavior are well-defined. Let's give it time to make up its mind.
UUP (dollar ETF)
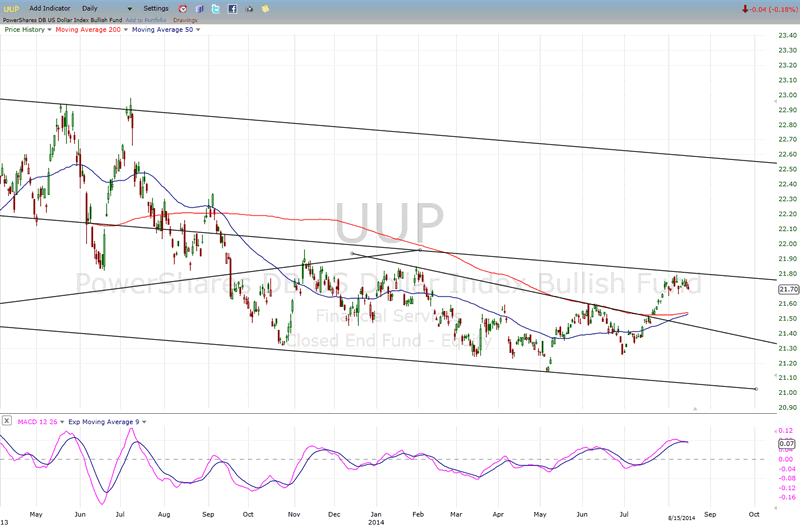
UUP is consolidating its recent advance just below the mid-channel resistance. This is not a sign of weakness, but could be preparation to move through the trend line. Like GLD, it needs to be given a little more time.
USO (US Oil Fund)
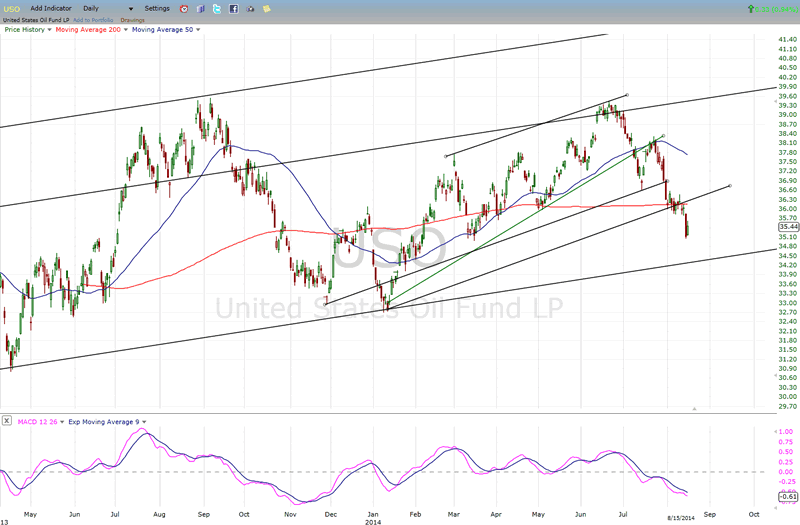
Why am I not surpried at USO's behavior last week? I have been bearish on this index for many months and see no reason to change my mind. I think it's only a matter of time before the long-term trend line is challenged.
Summary
SPX had a good rally after meeting its stated downside target. Last week's behavior -- which found strong overhead resistance exactly where it should have -- has brought an aura of uncertainty about what comes next. At the very least, some consolidation should be expected now that the slope of the rally has been downgraded. The new bottom channel line will have to contain the next correction if the index is to remain in an uptrend with the prospect of a new high.
FREE TRIAL SUBSCRIPTON
If precision in market timing for all time framesis something that you find important, you should
Consider taking a trial subscription to my service. It is free, and you will have four weeks to evaluate its worth. It embodies many years of research with the eventual goal of understanding as perfectly as possible how the market functions. I believe that I have achieved this goal.
For a FREE 4-week trial, Send an email to: ajg@cybertrails.com
For further subscription options, payment plans, and for important general information, I encourage
you to visit my website at www.marketurningpoints.com. It contains summaries of my background, my
investment and trading strategies, and my unique method of intra-day communication with
subscribers. I have also started an archive of former newsletters so that you can not only evaluate past performance, but also be aware of the increasing accuracy of forecasts.
Disclaimer - The above comments about the financial markets are based purely on what I consider to be sound technical analysis principles uncompromised by fundamental considerations. They represent my own opinion and are not meant to be construed as trading or investment advice, but are offered as an analytical point of view which might be of interest to those who follow stock market cycles and technical analysis.
Andre Gratian Archive |
© 2005-2022 http://www.MarketOracle.co.uk - The Market Oracle is a FREE Daily Financial Markets Analysis & Forecasting online publication.


