


Stock Market Uptrend Looks Underway
Stock-Markets / Stock Markets 2014 Aug 17, 2014 - 09:25 AM GMTBy: Tony_Caldaro

 The market opened the week with a gap up to SPX 1945, pulled back to 1928 by tuesday, then gapped up twice more during the week to hit 1964 on friday. Then some geopolitical news spooked the market and it sold off to SPX 1942 before rebounding in the afternoon. For the week the SPX/DOW 0.95%, the NDX/NAZ were +2.40%, and the DJ World index rose 1.65%. On the economic front positive reports were slightly more than negative ones. On the uptick: business inventories, export prices, the PPI, industrial production, capacity utilization and the budget deficit improved. On the downtick: the NY FED, consumer sentiment, the WLEI and weekly jobless claims rose. Next week we get the FOMC minutes, reports on Housing, Jackson Hole, Wy., and Leading indicators.
LONG TERM: bull market
The bull market continues to unfold as labeled. A Supercycle wave 2 low in March 2009 at SPX 667, kicked off Cycle wave [1] of Supercycle 3. Cycle wave bull markets unfold in five Primary waves. Primary waves I and II ended in 2011, and Primary wave III has been underway since the SPX 1075 low. Primary I divided into five Major waves with a subdividing Major wave 1. Primary III has divided into five Major waves as well, but Major waves 3 and 5 are subdividing.
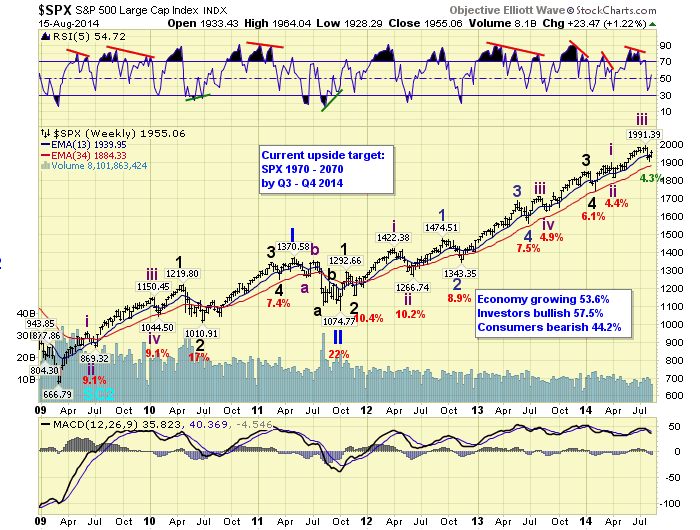
Major waves 1 and 2 completed in late-2011, and Major waves 3 and 4 completed in early 2014. A subdividing Major wave 5 has been underway since that SPX 1738 low. Currently it looks like Intermediate waves i, ii, iii and iv have completed, and the market is in Int. wave v. When it concludes it should end Major 5, and Primary III as well. Then the market should experience its largest correction since 2011 for Primary wave IV. After that, a Primary V should take the market to new highs again to end the bull market.
MEDIUM TERM: uptrend probable
After the Intermediate wave iii uptrend ended at SPX 1991/1985 we counted a complex zigzag down to SPX 1905. This zigzag alternated with the irregular zigzag for Int. wave ii. Both corrections produced similar market loses of 4.4% and 4.3%. At the Int. wave iv downtrend low we had a good oversold condition in the daily MACD, and a positive divergence in the daily RSI. The technical conditions were set for an uptrend to begin, and the market has rallied about 3% off that low.
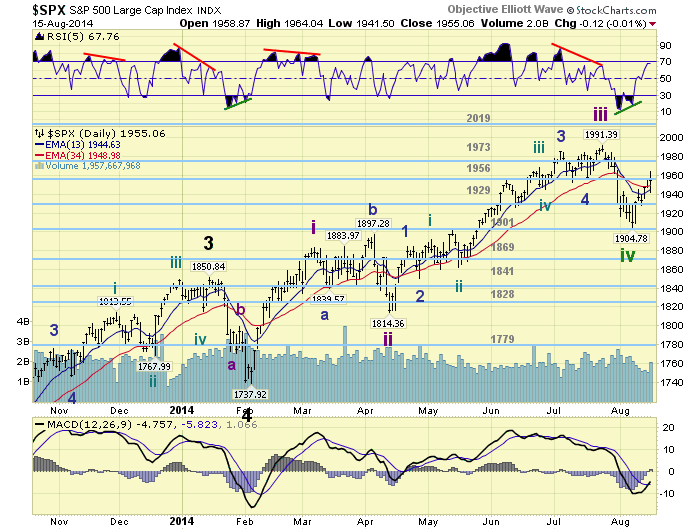
Off the SPX 1905 low we had a rally to 1945, a pullback to 1928, a rally to 1965, a pullback to 1942, and now a rally to 1955. We labeled the first rally and pullback as Minor waves 1 and 2. We are expecting this Int. wave v uptrend to unfold in five Minor waves, with a subdividing Minor wave 3. The rally to SPX 1965 on friday we labeled as Minute wave i of Minor 3, and the pullback to 1942, also on friday, could have been all of Minute wave ii. This would suggest the friday afternoon rally to SPX 1955 is the beginning of Minute wave iii.
Usually the daily RSI gets quite overbought during Minor wave 3’s. And thus far the RSI has yet to reach overbought. This suggests the market could be entering the best part of the uptrend. And, the recent uptrend confirmation by the NDX supports that scenario.
We offer one caveat. Should the SPX drop belows 1928 before the uptrend is confirmed the recent advance would be counted as an a-b-c rally to 1965 in an ongoing Int. iv downtrend. Medium term support is at the 1929 and 1901 pivots, with resistance at the 1956 and 1973 pivots.
SHORT TERM
Short term support is at SPX 1942 and the 1929 pivot, with resistance at the 1956 and 1973 pivots. Short term momentum ended the week above neutral. The short term OEW charts ended postive with the reversal level now 1951.
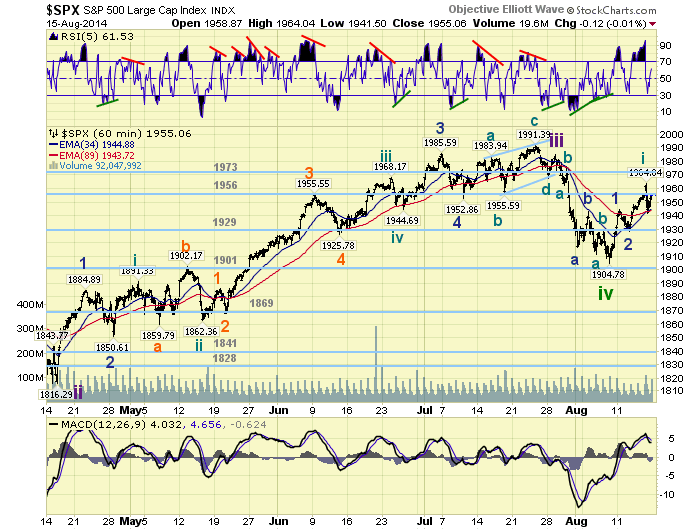
As noted above we labeled Minor waves 1 and 2 at SPX 1945 and 1928 respectively. If Minor 3 tops at 1.618 times Minor 1 it should reach SPX 1993. If Minute waves iii, iv and v top at 1.618 times Minute i, should Minute ii hold at 1942, Minor 3 should reach SPX 2000. Right now, the market’s objective is to clear the 1956 pivot range, and then the 1973 pivot range. For the entire uptrend we noted four levels last weekend: SPX 2003, the 2019 pivot range, SPX 2028 and the 2070 pivot range. Just some numbers to keep in mind in the weeks ahead.
FOREIGN MARKETS
The Asian markets were all higher on the week for a net gain of 2.2%.
European markets were also all higher for a net gain of 1.8%.
The Commodity equity group were all higher gaining 3.1%.
The DJ World index gained 1.65%.
COMMODITIES
Bonds are still uptrending and gained 0.6% on the week.
Crude is still downtrending but only lost 0.1% on the week.
Gold is still uptrending but lost 0.4% on the week.
The USD remains in an uptrend but finished flat.
NEXT WEEK
Monday: the NAHB at 10am. Tuesday: the CPI, Housing starts and Building permits. Wednesday: the FOMC minutes. Thursday: weekly Jobless claims, Existing home sales, the Philly FED and Leading indicators. Friday: a speech from FED chair Yellen at Jackson Hole, Wy. at 10am. Jackson Hole, FOMC minutes, Housing reports, should be an interesting week. Best to your weekend and week!
CHARTS: http://stockcharts.com/public/1269446/tenpp
http://caldaroew.spaces.live.com
After about 40 years of investing in the markets one learns that the markets are constantly changing, not only in price, but in what drives the markets. In the 1960s, the Nifty Fifty were the leaders of the stock market. In the 1970s, stock selection using Technical Analysis was important, as the market stayed with a trading range for the entire decade. In the 1980s, the market finally broke out of it doldrums, as the DOW broke through 1100 in 1982, and launched the greatest bull market on record.
Sharing is an important aspect of a life. Over 100 people have joined our group, from all walks of life, covering twenty three countries across the globe. It's been the most fun I have ever had in the market. Sharing uncommon knowledge, with investors. In hope of aiding them in finding their financial independence.
Copyright © 2014 Tony Caldaro - All Rights Reserved Disclaimer: The above is a matter of opinion provided for general information purposes only and is not intended as investment advice. Information and analysis above are derived from sources and utilising methods believed to be reliable, but we cannot accept responsibility for any losses you may incur as a result of this analysis. Individuals should consult with their personal financial advisors.
Tony Caldaro Archive |
© 2005-2022 http://www.MarketOracle.co.uk - The Market Oracle is a FREE Daily Financial Markets Analysis & Forecasting online publication.