


Growth and Inflation In America: Why Deflation Is Going to Burst Through
Economics / Deflation Aug 11, 2014 - 07:11 AM GMTBy: Jas_Jain

 Inflation is a lagging indicator even over a short-term, lagging by 6-12 months with respect to the GDP growth rate when the cyclical turns take place. Long-term inflation pressure has a very long lag time of 6-10 years. In the advanced economies of Western Europe, Japan and the US, where consumption is a big part of the GDP, the biggest contributor to the long-term inflationary pressures is the long-term GDP growth, driven primarily by the end demand, with inflation lagging by several years as businesses adjust to the rapidly accelerating demand, or the rapidly decelerating demand. This is particularly the case with the consumption oriented US economy.
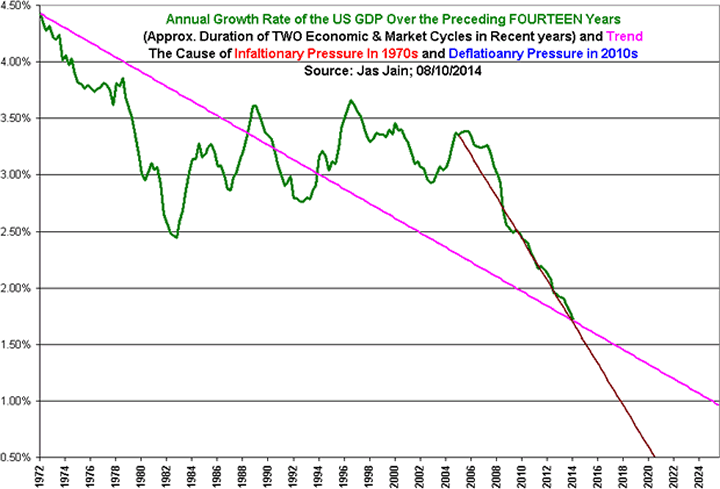
I have chosen 14 years to measure the long-duration growth because it represents roughly two business cycles in recent years, but there is nothing sacred about it; a 12-year, 15-year, or even a 20-year period would do just fine. Let us ponder at these facts:
1. The cumulative GDP growth during the 14-year period ending in 1972Q2 = 84%! (HOT, high noon of the Kondratiev Summer)
2. The cumulative GDP growth during the 14-year period ending in 2014Q2 = 26%!! (COOL, only the beginning of the Kondratiev Winter)
What followed the super hot growth of 1960s was the inflationary period of 1970s, a lag period of approximately 8 years. What brought down the inflation of 1970s was a 9 years and 2 months period of sharp contraction in the growth rate, beginning in late 1973, with three recessions during the period, two of which were severe recessions, with the cumulative growth of mere 20%, less than 2% annual rate. The growth had to be reigned down hard to bring down inflation in the following decade. This is partly shown by the low in 1983 in the attached graph.
Debt-Driven Growth in the US Since 1983
Things looked very bleak in the US at the end of 1982 with the unemployment rate in double digits, 10.8%. A new "scientific" discovery was made in the US by the policymakers, both economists and politicians, that we can promote economic growth via borrowing and spending, i.e., increasing the consumption debt (the sum of fiscal deficit and the increase in the household debt) much faster than the GDP over a very prolonged period. The federal debt outstanding during the 5-year period, 1983-1987, doubled under Reagan. The cumulative GDP growth during this period was 27.7%, of which 10% was due to the increase in federal deficit over the GDP growth and 10% was due to increase in the household debt over the GDP growth. What a champ! With huge growth in consumption debt a country that has borrowing power can kick the can down the road.
Exponential Growth In the Consumption Debt During 2001-2010
Election of GW Bush heralded an exponential growth in consumption debt with very lose fiscal policy and very lose monetary policy under Greenspan and Bernanke, all three Republicans. All the growth and more during this decade was a result of mounting borrow-and-spend, i.e., the growth for the decade would have been negative in the absence of the growth due to debt based consumption. A negative growth for a decade would have been far worse than the Great Depression. So, have we successfully avoided that outcome? NO. We have simply bargained for a worse outcome in the future. There are no free lunches despite all the "scientific" discoveries in economics. The four policymakers who have done the greatest damage to the US economy for the past 30 years are: Ronald Reagan, Alan Greenspan, GW Bush and Ben Bernanke. The real price of the 30 years of largesse would be paid within the next 10 years, most likely beginning soon.
We have been borrowing growth from the future for the past three decades and in spite of all the borrowing since 2001, greater than during the WW II, as a % of the GDP!, and spending we have had a very weak growth for the past 14 years. Just as the strong growth of 1960s was a harbinger of rapidly rising inflation in 1970s, the very weak growth of early 2000s is a harbinger of rapidly falling inflation rate in the coming decade. And that would translate into outright deflation.
Japan and the Euro Zone
I don't track growth and inflation rates for Japan and the Euro zone, but it seems highly likely that the deflationary pressures in Japan for more than a decade and in the Euro zone recently are a direct result of prolonged weak growth that leads to continued weak demand down the road as caution among consumers sets in.
Weak growth for the past 10-15 years means falling inflation rate for the next 6-10 years, the reverse of what we witnessed during the 1960s and 1970s in the US. Yes, long-term inflation has a very long lag time. The adjustment process by businesses and consumers does require a long period.
By Jas Jain , Ph.D.
the Prophet of Doom and Gloom
Copyright © 2014 Jas Jain - All Rights Reserved Disclaimer: The above is a matter of opinion provided for general information purposes only and is not intended as investment advice. Information and analysis above are derived from sources and utilising methods believed to be reliable, but we cannot accept responsibility for any losses you may incur as a result of this analysis. Individuals should consult with their personal financial advisors.
© 2005-2022 http://www.MarketOracle.co.uk - The Market Oracle is a FREE Daily Financial Markets Analysis & Forecasting online publication.