


EURUSD Time For A Bear Rally
Currencies / Euro Aug 09, 2014 - 12:35 PM GMTBy: Austin_Galt

 Recently I've been a bit out of whack on this pair, the EURUSD. I feel confident in the longer term projections. It's the daily machinations that I'm still trying to get in-synch with. Sometimes you just need to step back and let the market do its thing, not forcing the issue. And then out of the blue, that desired clarity appears. And that just may be happening now.
Let's investigate beginning with the daily chart.
Daily Chart
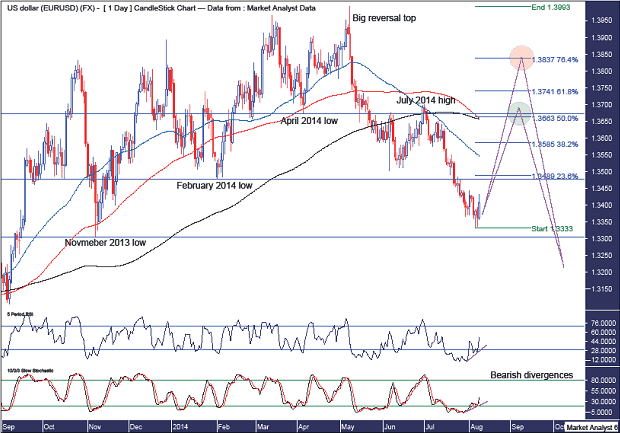
A few things of note here. Firstly, I have mentioned it before and I'll mention it again - the big reversal top in place just shy of 1.40. Seeing that big reversal top in May 2014, which was also a false break of the March 2014 top, solidified in my mind that the bull trend was over and a new bear trend was underway.
I have drawn three horizontal lines which outline the three previous swing lows. They are, in order, the April 2014 low, the February 2014 low and the November 2013 low. In this case, the first swing low is the April 2014 low with the second being the February 2014 low. Just looking at this second low, it appears more prominent than the first swing low. For my own purposes, I often refer to this first swing low as a minor swing low while the second swing low is a major swing low. I often find that when a new bear trend begins it breaks the previous minor swing low or lows and the first previous major swing low before embarking on its first bear rally.
Expecting a bear trend was in its infancy, I should have expected that major swing low in February 2014 to be taken out before seriously entertaining thoughts of a rally. Well, it has happened now and price looks to have pulled up just before the next swing low set in November 2013. Now, picking lows in a bear trend is an extremely hazardous game but this is actually quite a common occurrence for the first swing low in a new bear trend. That is, price breaks both the previous minor swing low and previous first major swing low before rallying.
I have added a Relative Strength Indicator (RSI) and a Stochastic Indicator and the low of 1.3333 a couple of days ago has been accompanied by bullish divergences in both indicators. So that is some evidence to expect a rally in price now.
I have also added moving averages with time periods of 50 (blue), 100 (red) and 200 (black). We can see the 50ma has already crossed over the 100ma and 200ma indicating bearishness. An even more bearish sign is the 100ma crossing over the 200ma. This looks very close to occurring. Now, what often happens when price makes a bearish crossover is price rallies. Just look at what price did when the 50ma crossed over the 100ma and 200ma as evidence of this. So while the moving averages behaviour indicates overall bearishness, it also suggests a rally in the short term would be no surprise at all.
Now that we've determined a bear market rally here is probable, we can attempt to predict where the rally might end. To do this I've added Fibonacci retracement levels of the move down from the big reversal top to the recent low. There are a couple of scenarios I have in mind here. What are they?
The first scenario revolves around the fact that the first rally in a bear market often makes a deep retracement. My personal favourite level is the 76.4% level as it is often forgotten my technical analysts that focus on the popular 61.8% level. In this case the 76.4% level stands at 1.3837. This is shown in the orange highlighted circle.
The second scenario is an interesting one and has me intrigued enough to divert my attention away from the 76.4% level. It is in the green highlighted circle and revolves around the 50% level which was popular with both wizards of yesterday, Gann and Fibonacci. This level stands at 1.3663. Interestingly, this level is also around the same level the 100ma and 200ma look to be crossing over at. Price often rallies back to its moving average levels. Also, the recent high was at 1.37 and if price were to turn back down there then a powerful double top with the trend would occur. Hmmm
So, let's say if the 1.37 level is taken out then I will divert my attention back to the 76.4% level above 1.38.
Now let's quickly reacquaint ourselves of the big picture by looking at the yearly and monthly charts.
Yearly Chart
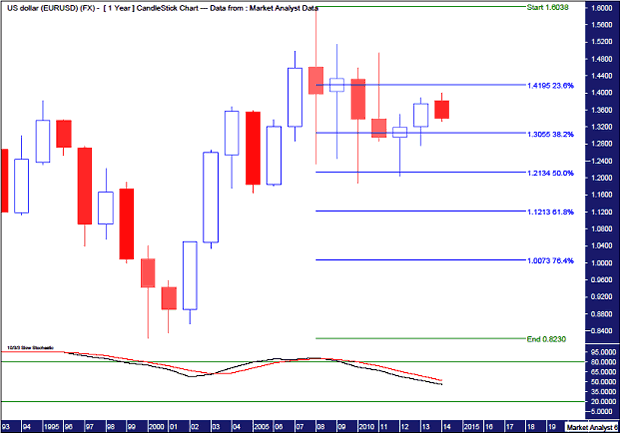
We can see a higher high in place after the 2008 all time high at 1.6038. Since then price has retreated in a corrective looking fashion. Very wishy washy type trading. The low to this consolidation pattern so far was in 2010 at 1.1877. Perhaps that is the next higher swing low.
I have added a Stochastic Indicator which is trending down and I'm not expecting that to change this year. 2015 may be a different story. Until then........
I have added Fibonacci retracement levels of the upleg from the all time low of 0.8230 in 2000 to the 2008 high. Price looks to be finding support at the key 50% level after a couple of tests already.
And as price came into this consolidation pattern from the downside, it should eventually leave the pattern in the same direction - to the upside. The 2010 low at 1.1877 currently appears to be the line in the sand and unless that level is broken then bias should be given to the upside over the long term.
Let's move on to the monthly chart.
Monthly Chart
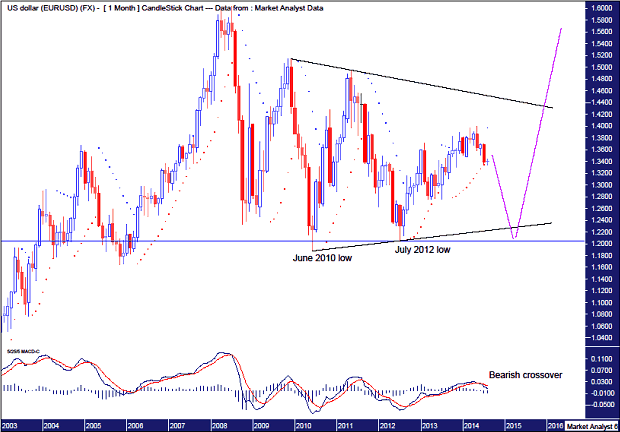
We can see in more vivid detail the consolidation pattern in full effect. I have added a Moving Average Convergence Divergence (MACD) indicator which shows a bearish crossover confirmed last month. This augurs for lower prices in the months ahead. Now that doesn't mean price can't rally now, which I suspect. If say price rallies into the end of August then that may not be enough to alter the bearish indication.
I have also added a Parabolic Stop and Reverse (PSAR) indicator which shows the dots busted on the downside. So while a rally here is possible, going forward the bias has to be given to the downside.
I have drawn two black trend lines to denote the borders of this consolidation pattern. As price now appears headed down over the longer term, I have focused on the bottom uptrend line. The trend line links the June 2010 low with the July 2012 low. A lot of chartists will focus on this trend line as price eventually makes its way there. However, it appears too obvious so I suspect price can make a marginal break of it running stops that will have built up below there. That would get most bulls running for cover. Just the opportunity for a contrarian to zoom in and make hay while the sun shines!
An interesting potential setup is price makes a double bottom with the July 2012 low around 1.2044. That double bottom, being above the June 2010 low, would be classed as being with the trend. If that occurs then a powerful move up could be expected. That is my current target for the next major low.
As it stands today, price looks on the verge of a decent rally higher. I generally don't like to get involved in trades against the trend. However, if price pulls back early next week to say around 1.336, I may just have a small play for entertainment purposes. Otherwise I'm happy to let it go and wait for the big play short opportunity further down the road. What I won't be doing is chasing a bear rally!
Bio
I have studied charts for over 20 years and currently am a private trader. Several years ago I worked as a licensed advisor with a well known Australian stock broker. While there was an abundance of fundamental analysts there seemed to be a dearth of technical analysts, at least ones that had a reasonable idea of things. So my aim here is to provide my view of technical analysis that is both intriguing and misunderstood by many. I like to refer to it as the black magic of stock market analysis.
Please register your interest in my website coming soon. Any questions or suggestions, please contact austingalt@hotmail.com
© 2014 Copyright Austin Galt - All Rights Reserved
Disclaimer: The above is a matter of opinion provided for general information purposes only and is not intended as investment advice. Information and analysis above are derived from sources and utilising methods believed to be reliable, but we cannot accept responsibility for any losses you may incur as a result of this analysis. Individuals should consult with their personal financial advisors.
© 2005-2022 http://www.MarketOracle.co.uk - The Market Oracle is a FREE Daily Financial Markets Analysis & Forecasting online publication.