Silver Price Outlook for Year End - MAP Wave Analysis
Commodities / Gold and Silver 2014 Aug 07, 2014 - 12:25 PM GMTBy: Marc_Horn
 Every now and again to amuse myself I try catch up on gossip and read the featured articles about gold and silver! Quiet a read especially when the same methods give so many different results depending on how prices moved in the last few days! Suffice to say my MO indicator is wonderful - just see if the top 10 best of the week read articles, check out the gold and silver ones, count how many are bullish or bearish on prices and they move the opposite way of the majority!
So some obvious misleading statements - the PM's are seasonal - mark the highs and lows on a monthly chart (depending on which months you take for starters depends on who you read!) and count for yourself just how seasonal they are not! You have not got very good probabilities - that is what counts - tipping them in your favour!
Then of course there is the nonsense of paper is not real money - only gold and silver are! A tidbit for those that have not heard of it - the longest used money was actually the British wooden tally, which was successfully used for over 700 years! No gold or silver!
That is because the gold bugs (and most people generally) fail to understand - what money actually is! Money is simply a commodity that can be universally where it is traded be exchanged for goods and services - AS SIMPLE AS THAT - NOTHING ELSE! In order to work its users need confidence that it will retain value and be accepted. The issue is NOT WHAT IS USED AS MONEY BUT WHO CONTROLS IT. I would strongly suggest that you watch THE CORRUPT ORIGINS OF CENTRAL BANKING.
And I find it amazing how people still claim that the price of gold and silver do not reflect what prices should be. What should it be? Manipulated or not the price is ONLY WHAT PEOPLE ARE PREPARED TO PAY FOR IT! How is it that some just cannot accept fact! If someone believed (had confidence) that they could make a buck or two on ANYTHING then they would invest in it! Governments are just brain dead thinking that it is as simple as just dropping interest rates - well if you do not have confidence that you can make a profit it does not matter what they are! We have had close on zero interest rates and other than shopping no investment is being made! Investment is what generates wealth! Why do the companies not invest - they do not believe they can make a return. That is why they are so cash loaded.
Then the best is how the technical analysis changes from bullish to bearish or vice a versa every week! You talk about quoting what suits the moment! Some of the patterns are just wonderful and I have not even heard of half of them! It is a bit like Elliot Wave where you pretty much put in any wave count that you think might look right!
Enough ranting and raving - some cycle and technical analysis - MAP Wave Analysis is a methodical approach which removes as much subjectivity as possible to reduce emoitions which if you read above results in lucky, or in most cases unlucky trading!

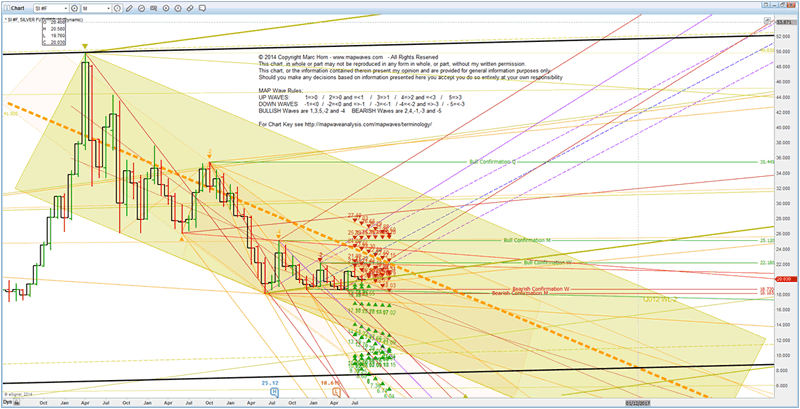
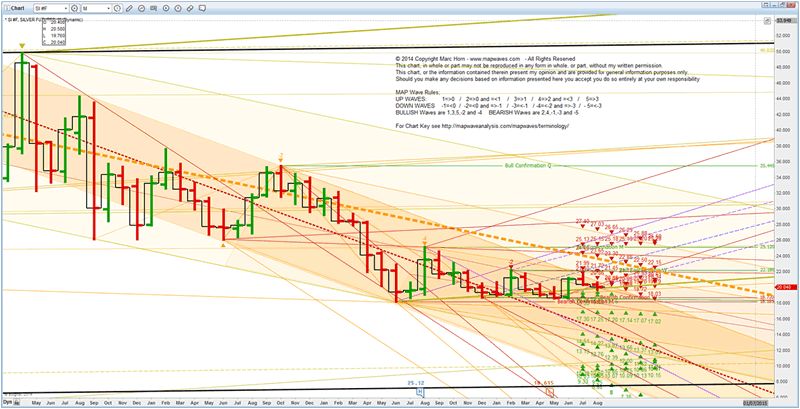
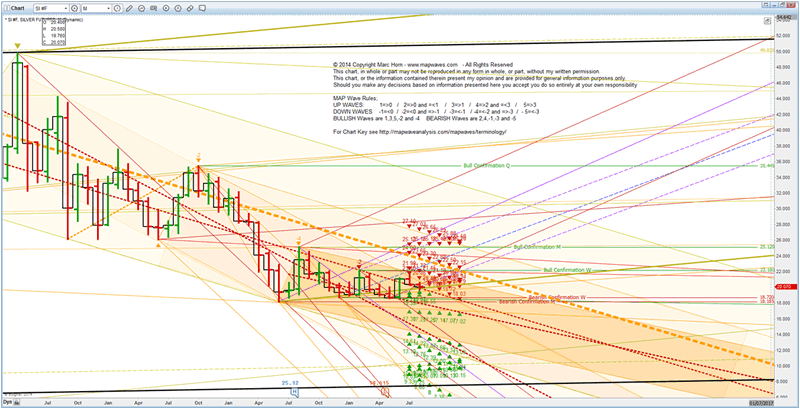
Above are monthly support and resistance levels for silver based on expect price movement for the rest of this year. They will be updated monthly with comment as this report really covers the price movement of silver for the at least the next 9 months, and possibly upto mid to late 2015.
Silver prices are in the lower half of the Q channel and have not been in the top half since March 2013. This projects an ideal December 2017 low of 8.60.

Now if we look at the 3 monthly channels and their ML’s. Prices are still within the M012 channel, having worked their way from its MLL across to its MLU. If prices continue within this channel which currently there is no evidence otherwise the ideal wave target for this correction is for a July 2015 low of 7.75. Prices need to decide by September which channel will complete this correction. The other 2 channels are discussed after M012 channel image below.

The next channel projects an ideal March 2017 low of 8.18. As you can see prices have worked their way above the M012 ML, as well as M234 ML, however have been retained by the M012 MLU in July, and so far again the August high as well as shown.

Finally the current M234 channel projects an ideal July 2017 low of 8.40. Prices after the low od M-3 have worked their way back to the MLU and bounce off it last month at the intersection with the M012 MLU, and continued the downtrend in silver prices. For those thank htink I am pesimistic I have shown 2 possible bullish forks, of which silver today bounced off the lower MLU, so they are offering some support, however as W-2 made it no where near it ML the pressure on silver remains downward.

So what you have seen is that indeed there is order to the decline in silver, as there is in gold and it is predictable! So stop listening to the nonsense of the masses - remember the majority MUST be wrong before a change in trend can occur. Change your behaviour if you dont want to loose everything when the contagion starts in the sovereign debt crisis.
Their principles are so simplistic, and being a believer in the KISS principle (Keep It Simple Stupid) I quickly took to them.
To me it was clear though that it was not the result of Newtonian physics, but human behavior!
MAP Wave Analysis gives unemotional high probability projections, BUT ONLY IF YOU USE THE CORRECT PIVOTS!
MAP Wave Analysis is based on the combination of my modifications of Elliott Waves, Babston's Action and Reaction, and, Andrews Pitchforks, all of which unfortunately are so misapplied. It would appear that they all took their secrets with them to their graves.
Their principles are so simplistic, and being a believer in the KISS principle (Keep It Simple Stupid) I quickly took to them.
To me it was clear though that it was not the result of Newtonian physics, but human behavior!
MAP Wave Analysis gives unemotional high probability projections, BUT ONLY IF YOU USE THE CORRECT PIVOTS!
A good starting point is to speak the same language, so start with the Terminology which you can refer back to whilst going through the Theory. For a quick summary see my first publication The Euro as an Example of my Techniques
By using this MAP Wave Analysis (MWA) you confirm that you are personally responsible for any and every decision you make based on any content found on this site.
- You confirm that you have read and agree to abide by the Copyright and Intellectual Property Rights as stated .
- You confirm that you have read and agree to follow Your Duty of Care as stated
- You confirm that you have read and agree to and take full personal responsibility for your decisions as stated in the Disclaimer.
- You confirm that you have read and agree to and will abide by principles of my Terms of Service as stated.
For other articles published click here
© 2014 Copyright Marc Horn- All Rights Reserved Disclaimer: The above is a matter of opinion provided for general information purposes only and is not intended as investment advice. Information and analysis above are derived from sources and utilising methods believed to be reliable, but we cannot accept responsibility for any losses you may incur as a result of this analysis. Individuals should consult with their personal financial advisors.
© 2005-2022 http://www.MarketOracle.co.uk - The Market Oracle is a FREE Daily Financial Markets Analysis & Forecasting online publication.


