


Gold and Silver Price Ready to Rally?
Commodities / Gold and Silver 2014 Aug 06, 2014 - 07:23 AM GMTBy: Austin_Galt

 Since my last reports on both gold and silver, price has come down to some key levels identified in those reports. So will both gold and silver turn up from here? Let's have a look at the charts and do our best to find out.
Now keeping in mind that my longer term view on both gold and silver is that they are currently in a consolidation phase within an overall bear trend with the final low still to come, most likely in 2015. This has been detailed in previous reports.
I'm always super wary when dealing with price that is in correction mode. Trading against the main trend is generally not to my liking. But let's give it a crack.
Gold and silver put in a nice rally recently with both topping out in July. From previous analysis, we have determined that a multi month rally is now underway. So this current pullback should bottom out and lead to the next rally which takes out the July highs.
On both charts I have added Fibonacci retracement levels of the recent run up combined with a Fibonacci Fan. Let's start with the gold chart.
Gold Daily Chart
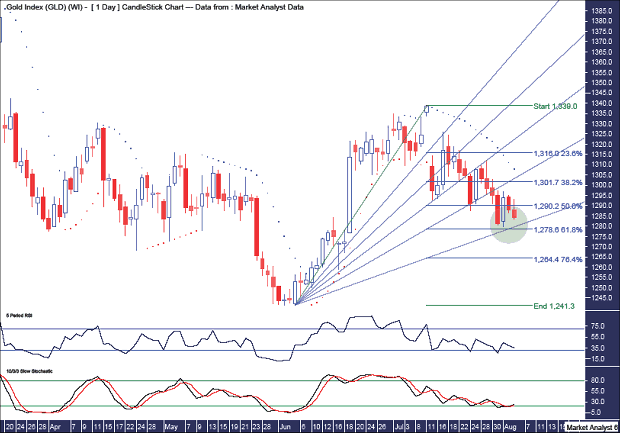
In the green highlighted circle on this gold chart, we can see price came down a couple of days ago for a near direct hit on the 61.8% level. The low price was a whisker under US$1280. Interestingly, price is right in the zone of where this 61.8% level intersects with the 76.4% angle. I would be starting to get a bit of the heebie jeebies over the health of the multi month rally if price doesn't hold this area. If price is going to turn up, then there's no better place and time to start!
I have added both a Relative Strength Indicator (RSI) and Stochastic Indicator. The Stochastic has had a bullish crossover and is at a low level so a price rise wouldn't surprise there. The RSI is reasonably low and while nothing conclusive can be drawn from it, a price rise would also not surprise.
Let's move on to the silver chart.
Silver Daily Chart
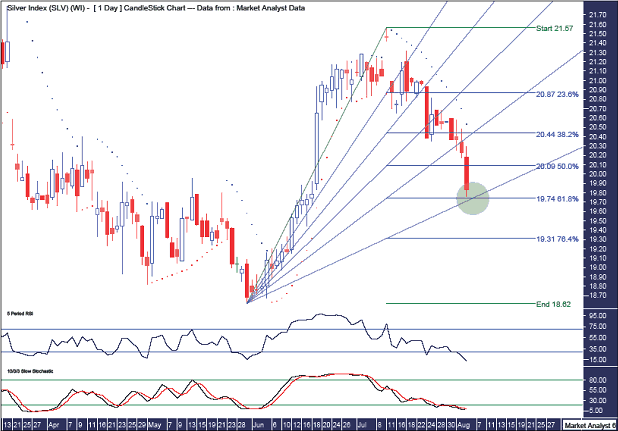
Once again, we can see price has come down to the 61.8% level and also where that level meets the 76.4% angle. This can be seen in the green highlighted circle. So, just as with gold, here and now is the perfect area for silver to end the correction and resume the rally.
I've also added the same indicators as with gold. The RSI on the silver chart is showing an extremely negative reading. Much more so than on the gold chart. Surely a bounce at the minimum is just around the corner. The Stochastic is also at very low levels and while there is no bullish crossover yet, it is certainly threatening one.
Another difference between this chart and that of gold is silver looks to be bottoming now while gold is potentially putting in a higher low. A little bullish divergence perhaps?
So, it looks like it's do or die time for the multi month rally in gold and silver. I favour the "do" scenario.
Bio
I have studied charts for over 20 years and currently am a private trader. Several years ago I worked as a licensed advisor with a well known Australian stock broker. While there was an abundance of fundamental analysts there seemed to be a dearth of technical analysts, at least ones that had a reasonable idea of things. So my aim here is to provide my view of technical analysis that is both intriguing and misunderstood by many. I like to refer to it as the black magic of stock market analysis.
Please register your interest in my website coming soon. Any questions or suggestions, please contact austingalt@hotmail.com
© 2014 Copyright Austin Galt - All Rights Reserved
Disclaimer: The above is a matter of opinion provided for general information purposes only and is not intended as investment advice. Information and analysis above are derived from sources and utilising methods believed to be reliable, but we cannot accept responsibility for any losses you may incur as a result of this analysis. Individuals should consult with their personal financial advisors.
© 2005-2022 http://www.MarketOracle.co.uk - The Market Oracle is a FREE Daily Financial Markets Analysis & Forecasting online publication.