


Silver Price Rally Could Fail due to Scary CoTs Reading
Commodities / Gold and Silver 2014 Aug 04, 2014 - 03:13 PM GMTBy: Clive_Maund

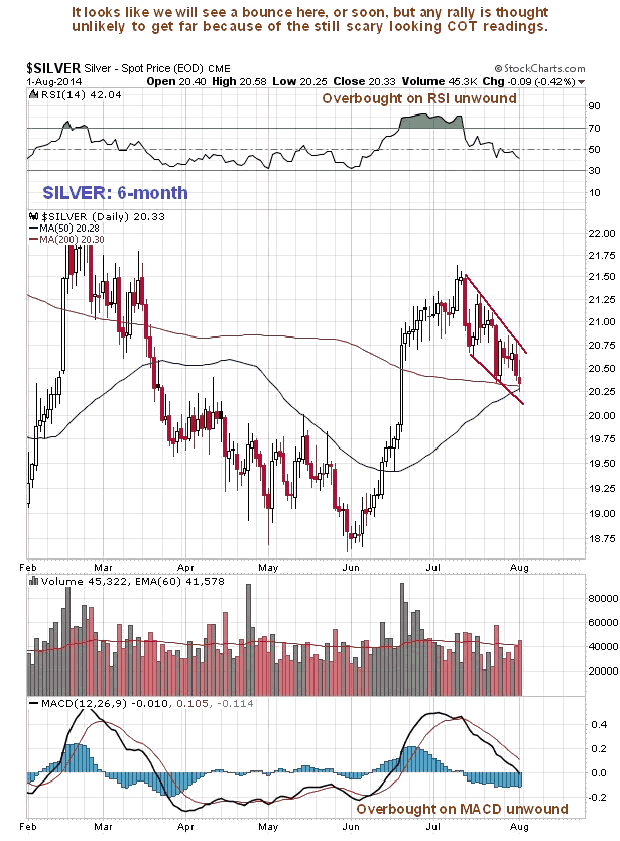
 We called the exact top in silver to the day in the last update 3 weeks ago, as it has since reacted back. Although a brief relief rally now looks likely, the still extreme COT readings suggest that silver has just put in an intermediate top. On its 6-month chart we can see how it has reacted back from the peak to arrive at an area of support at its principal moving averages, with its earlier overbought condition having completely unwound. This set of circumstances makes a bounce likely. However the COT structure has barely eased in recent weeks, which means that any rally here is likely to be short-lived and followed by renewed decline.
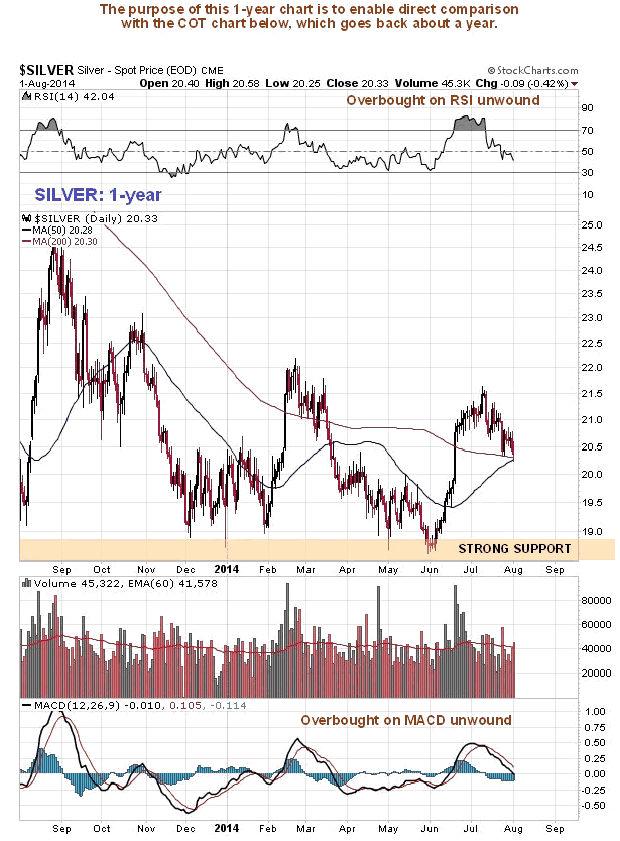
The 1-year chart for gold is shown below for the purposes of comparing it to the COT chart immediately below it...
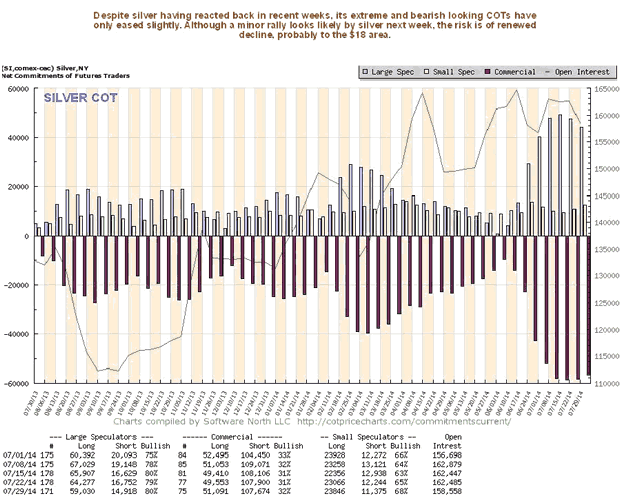
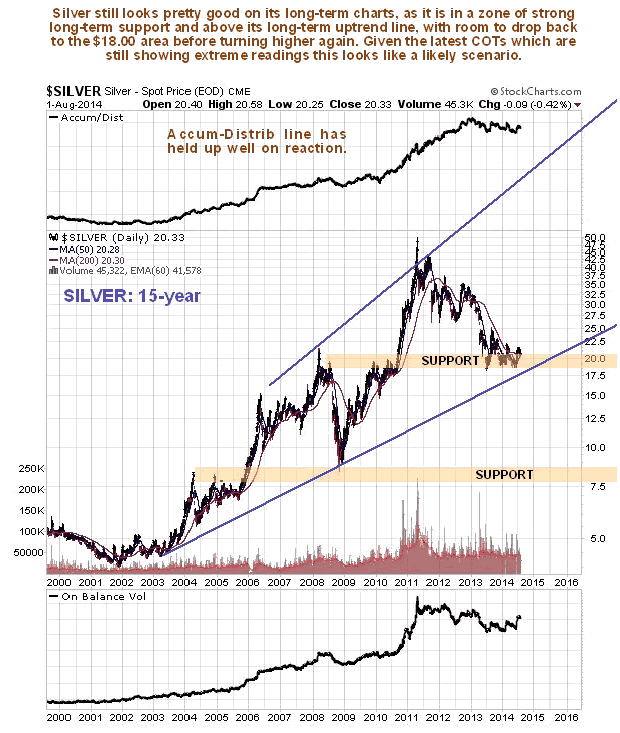
Commercial short and Large Spec long positions are still at a very high level, having only eased marginally last week. This is not good news for silver bulls, and suggests that, near-term rally or not, silver is likely to drop back to the $18 area at the supporting trendline of its major uptrend channel shown on its long-term 15-year chart lower down the page, and possibly lower. Bulls will want to see the COTs ease considerably on such a drop.
The 4-year chart for silver doesn't exactly look to hot, although this should be viewed in conjunction with the 15-year lower down the page.
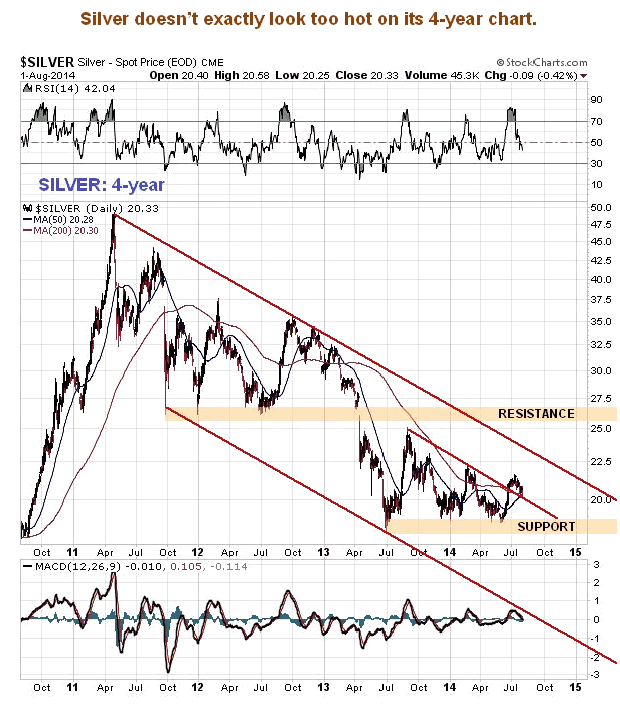
Other than the admittedly scary COT chart, the long-term 15-year chart for silver still looks good, as it is now in a zone of strong support above the support of its long-term uptrend line.
By Clive Maund
CliveMaund.com
For billing & subscription questions: subscriptions@clivemaund.com
© 2014 Clive Maund - The above represents the opinion and analysis of Mr. Maund, based on data available to him, at the time of writing. Mr. Maunds opinions are his own, and are not a recommendation or an offer to buy or sell securities. No responsibility can be accepted for losses that may result as a consequence of trading on the basis of this analysis.
Mr. Maund is an independent analyst who receives no compensation of any kind from any groups, individuals or corporations mentioned in his reports. As trading and investing in any financial markets may involve serious risk of loss, Mr. Maund recommends that you consult with a qualified investment advisor, one licensed by appropriate regulatory agencies in your legal jurisdiction and do your own due diligence and research when making any kind of a transaction with financial ramifications.
Clive Maund Archive |
© 2005-2022 http://www.MarketOracle.co.uk - The Market Oracle is a FREE Daily Financial Markets Analysis & Forecasting online publication.