Gold And Silver New World [Dis]Order Continues To Slip
Commodities / Gold and Silver 2014 Aug 02, 2014 - 12:59 PM GMTBy: Michael_Noonan
 Earlier in the year, we stated 2014 could be like 2013, price-wise, and that appears to be
playing out. However, as the idiom goes: appearances can be deceiving, and it is certainly
true of the chart prices for gold and silver. The natural forces of supply and demand would
have PM prices much higher, if for no other reason than an inflation adjustment. It is the
ongoing exertion of unnatural forces that have been dictating prices for so long.
The irony of the go-nowhere-but-down price action, since the highs of three years ago, is that the charts do not portend the unfortunate possibility of war. By the conclusion of the sentence just written, it is apparent that war has been dominating the news over the past decade but in smaller, but still deadly skirmishes, as opposed to bigger conventional wars. First, Bush Jr, now Obama have been pushing very hard for war of any kind in the hopes of preserving the existence of the fiat Fed “petro-dollar” as the world’s reserve currency.
There is no country that has initiated more wars than the US, both directly and indirectly, and no single Western country leader has been leading the charge for war than Obama. As the active agent carrying out the behind-the-scenes decisions for the New World [Dis] Order as it “seems” to lapse further and further into chaos, Obama has been alienating just about every other country, friend or foe.
The most serious situation remains Ukraine. It makes no difference to Obama that the knee-jerk reaction blaming Russia for the purposeful downing of the Malaysian plane has proven totally false, adding more innocents killed in the pursuit of provoking Putin and casting Russia in a bad light. Increasing sanctions over other [useless] sanctions is not finding favor in the European countries that face meaningful economic negative repercussions. All that the sanctions are accomplishing is greater and greater isolation of the war-bent US, while expecting other countries to bear the costs, economically and politicall.
A few weeks ago, our article on Germany being pivotal in leaving the Western fold and aligning with the growing Eurasion force, here, is still more important than ever. If only Germany were less equivocating and took a firmer stance. Why not, Germany? The US refuses to return your gold, ["If you do not hold it, you do not own it" applies to nations as well as individuals], and the NSA has been engaging in espionage on a massive scale. If this is not enough reason to be affronted and accompanied by an immediate reaction that shows backbone, then hypocrisy seems to be the main diplomatic means for all of Europe and not just Germany.
There is also a broader point to be made. If the US can get away with offending its closest allies and still have support from them, it goes to show how far the US is willing to go in order to defend its main ATM source, exporting the petro-dollar as the world’s reserve currency at the expense of every other nation holding US Treasury bonds, [not so much anymore in BRICS-land] The choice the US offers to its allies is: War with us, or switch to the other side that is building economic ties in order to prosper, but if you switch, you will suffer financial repercussions. That tune has been wearing very thin.
All central banks around the world are insolvent. Almost all Western countries are also insolvent, held together by paper fiat and massive amounts of derivatives that few lay people comprehend. No matter. Those in charge of the accomplice Western governments are not willing to risk their power and “prestige” and are willing to destroy nations in order to save the elite’s banking system.
Back to Germany. It has every reason to take a leadership role in telling the US that war and sanctions are not viable options. German businesses, at least 3,000 of them, have strong economic ties to Russia, and increasing ties with China. Frankfurt is vying to be a major financial player with its Yuan swap facility, seeking to best London. Germany receives 30% – 40% of its energy supplies from Russia, not a situation conducive to supporting harmful sanctions against that country.
India just stood up to the World Trade Organization by refusing to sign on the a global trade agreement at the proverbial 11th hour, putting the WTO future in doubt. As a member of BRICS, India is taking the necessary stance for future economic growth and sovereign stability. The number of countries wanting to be associated with the BRICS cartel grows month-by-month. The US is slowly but surely slumping into world isolation that will end very badly for vastly unaware and politically comatose US citizens.
China, Russia, and now India have become the standard-bearers for disengaging from the US dollar as a trade requirement. For as long as the rest of the Western world allows the US to call the shots, gold and silver will stay at/near these current low levels. The elites and the US FED will not allow gold to rival it worthless fiat “dollar.” The problem for the elites and the US FED is that more and more nations are peeking behind the curtain only to see that the “Wizard” is as phony as its fiat.
When you look at the charts for gold and silver, it is obvious that the[hollow] messages of the US are having their desired effect, for the charts show that the protracted TR of the past few years has not ended, nor do it exhibit any sign[s] of ending. The dumping of $3.7 billion worth of gold at one time, in mid-July, proves manipulation by central banks is alive and well.
Apart from the paper market, there is no reason for anyone to change their habit of buying physical gold and silver. The end game, [of manipulation and US/UK paper derivative dominance] is closer and closer. When will the PM stake finally be driven into the “heart” of the elite’s banking system is an unknown, and absolute unknown. The breakdown has been gradual, but it will end with a speed that will take many by a shocking surprise. The best preparation against the collapse of the fiat banking system is the accumulation of gold and/or silver. This is not a “prepper” site, so advocating buying guns, ammunition, food and storing water is for others to promote as a worthwhile endeavor.
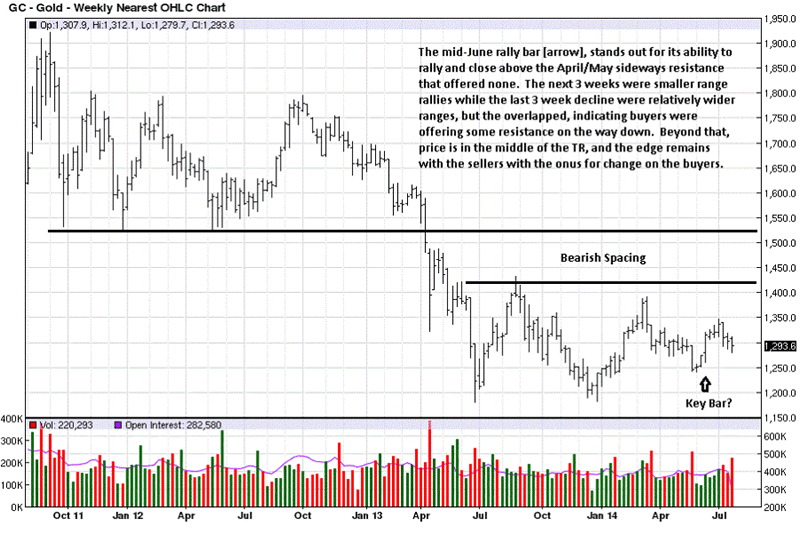
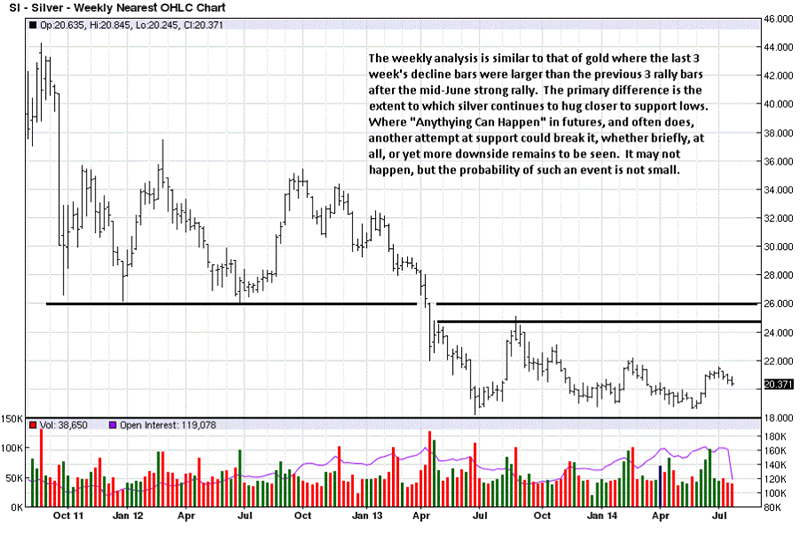
The end of each month presents an opportunity to look at the larger time frame context. At the end of July, there is little to be gleaned from the monthly. In this time frame, as well as the weekly, price continues to move along the RHS of the TR [Right Hand Side of the Trading Range]. It gets closer and closer to a resolve, a breakout one way or the other. When price is in the middle of a trading range, the level of knowledge is at its lowest.
The fact that the decline is holding slightly under support is a mild overall positive, but it is not a factor as a reliable degree of support.
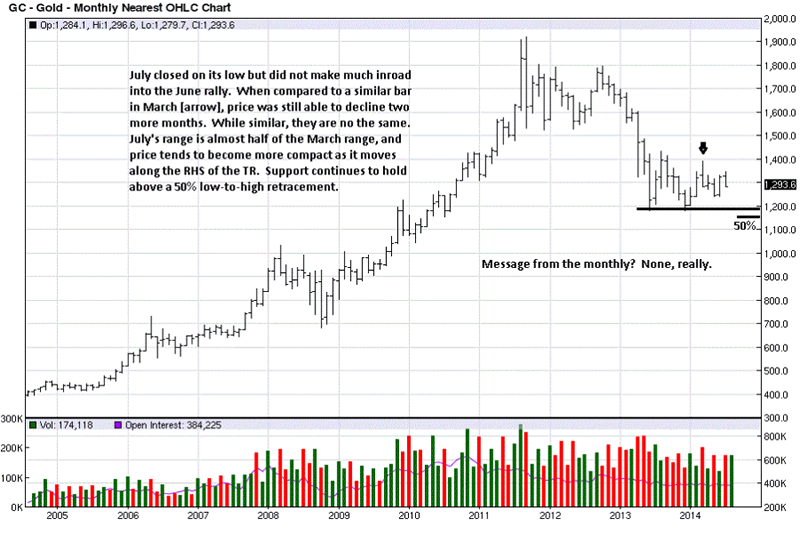
Most want answers as to what the market will do. Based on the monthly and weekly, not much can be expected as price remains about in the middle of the TR. When we say that the level of knowledge is at its lowest, price can rally to the top of the range and still fail, or decline to the bottom and hold. The odds of one event over the other are 50%, or a coin toss, and those are unfavorable odds upon which to base a decision to buy or sell.
The arrow indicating what could be a key bar will not tell anyone what the market will do in advance, but watching how price develops in that 8 week trading area can give clues on the probability of price moving one way or the other. For now, the rally of 8 weeks ago continues to hold. If the range[s] narrow and volume lessens on the correction, it will be an indication that sellers are not or cannot press the market lower, and that can set up a buy opportunity. That information can only be known after the fact, but by following the market’s direction soon after confirmation can lead to greater probability trades that have reduced risk and a higher likelihood of being profitable.
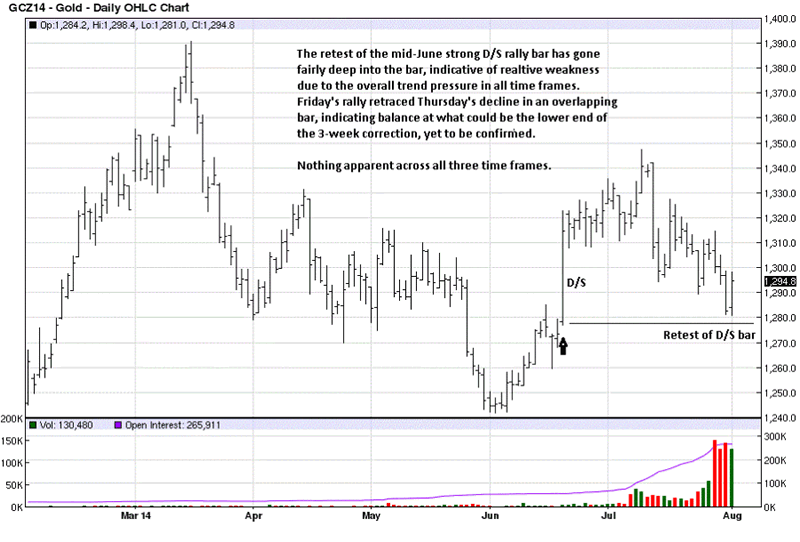
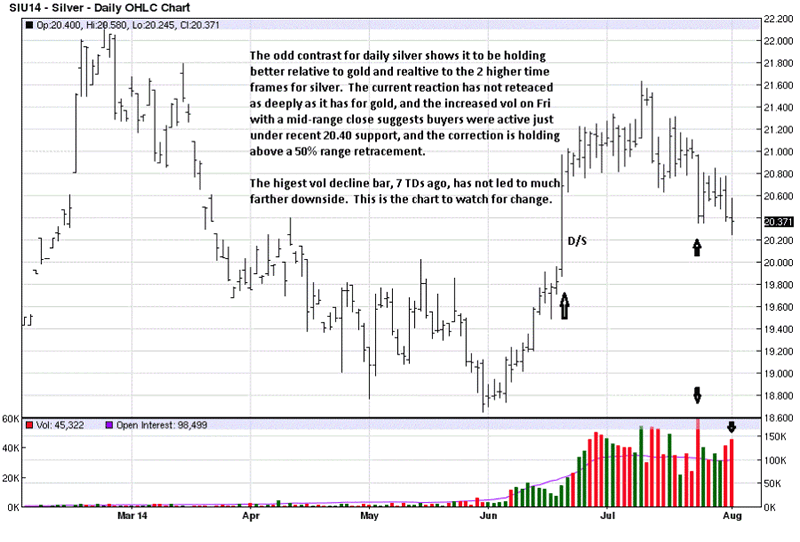
The fact that the correction on the daily chart has almost reached the low-end of the D/S bar [Demand overcoming Supply], tells us the general tome of the market for buyers is not that strong. Buyer beware.
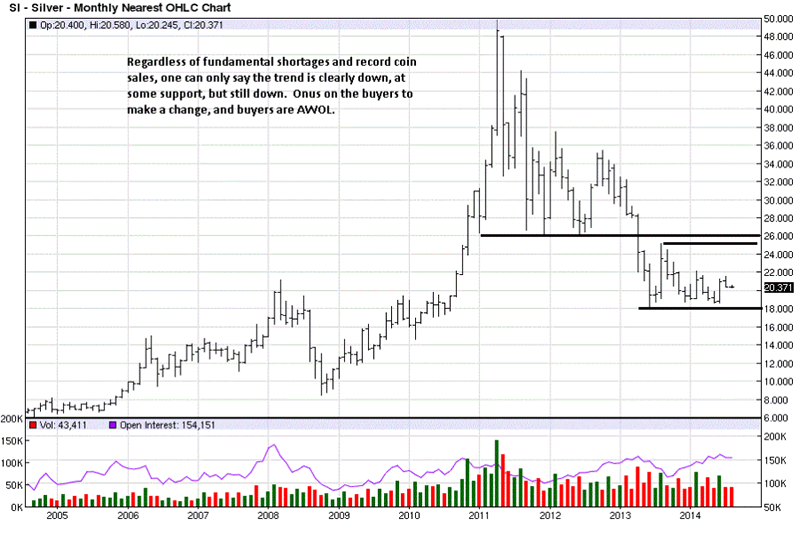
Clearly, silver remains entrenched in its lower level TR within a broad down trend. Before any rally can develop, buyers must prove themselves by strong rallies and increased volume that are sustained with less give-back on any correction[s]. For now, buyers are AWOL [Absent WithOut Leave].
Weekly silver is similar to weekly gold in its price behavior, although the retracement is not quite as deep for silver. A look at the daily may be more helpful.
Of all the charts, daily silver appears to be the most constructive, from a long side view. Silver is weaker than gold, but this daily chart is stronger than the daily chart for gold. There are two interesting factors that make watching silver as a better guide. Firstly, the current correction is not as deep into the D/S bar, silver being in a weaker overall market makes it a better relative sign of behavior. Secondly, the increased .volume on Friday was greater than the volume on Thursday’s decline.
This is a bit more detailed, but it demonstrates how the market sends the most reliable information. Thursday’s decline bar was much wider, showing greater ease of decline, and price closed on the low. Compare Friday’s smaller range on increased volume. An increase in volume means more selling and buying effort, and note that the close was closer to the middle of the bar, just under the open, and not much lower than Thursday’s close.
Here, the market is telling us that on increased effort the range was smaller, the close was nearer the middle, and not much lower when compared to Thursday. For all the increased effort, why couldn’t sellers push price lower and have a poorer close? The answer is that buyers were also increasing their effort and were relatively stronger than sellers which is why the range did not extend lower and price did not close much lower. We see concrete signs of buying activity near the end of an almost 3 week decline.
One more point. The highest selling volume occurred 7 TDs earlier. What has been the result of all the largest selling effort? Did price continue lower? No, it moved sideways over the next 5 TDs. Why did not price go lower? Because a good part of that increased volume was in the form of stronger handed buyers absorbing the sellers. Strong hand money does not care about a 5, or 10, or even a 50 cent move against them. Their main concern is establishing position.
Always remember, smart money is the cause of sharp volume increases, so one must pay attention to where they occur and why. The fact that price moved sideways instead of continuing lower was a clue. The fact that volume increased again, near the low and not much lower than the close from 7 TDs earlier, tells us that the increased volume is smart money quietly accumulating long positions, leaving behind tell-tale signs that anyone can see, if they look and take the time to sort out.
Is the analysis on point? Whether it is or not is not the point. What matters is we have a read on developing market activity that suggests buyers are stepping up their activity. It could be in the form of short-covering and not necessarily new position buying. What this information does is provide an anchor for tracking subsequent developing market activity to see if it confirms these observations. This is what leads to higher quality trades.
By Michael Noonan
Michael Noonan, mn@edgetraderplus.com, is a Chicago-based trader with over 30 years in the business. His sole approach to analysis is derived from developing market pattern behavior, found in the form of Price, Volume, and Time, and it is generated from the best source possible, the market itself.
© 2014 Copyright Michael Noonan - All Rights Reserved Disclaimer: The above is a matter of opinion provided for general information purposes only and is not intended as investment advice. Information and analysis above are derived from sources and utilising methods believed to be reliable, but we cannot accept responsibility for any losses you may incur as a result of this analysis. Individuals should consult with their personal financial advisors.
Michael Noonan Archive |
© 2005-2022 http://www.MarketOracle.co.uk - The Market Oracle is a FREE Daily Financial Markets Analysis & Forecasting online publication.


