Gold Correction Completing- Bull Market About to Resume
Commodities / Gold & Silver May 11, 2008 - 09:04 AM GMTBy: Clive_Maund
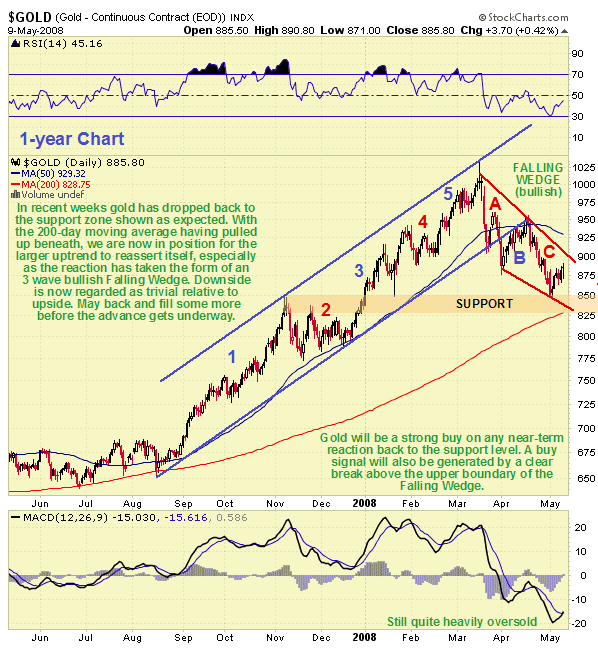
 Gold's corrective phase is believed to be complete, meaning that it is now in position to begin another major uptrend. In the last update, which was about 5 weeks ago, we were looking for it to continue to react back to support in the $830 - $850 area above its 200-day moving average, and that is exactly what it has done.
On the 1-year chart we can see how the fine strong uptrend from last August, which broke down into a 5-wave sequence, culminated in a brief sojourn above the psychologically important $1000 level, accompanied by great fanfare in the press, before a classic 3-wave correction back towards the 200-day moving average set in.
This reaction has brought the price back to a zone of strong support above the rising 200-day moving average, where it remains quite heavily oversold despite last week's rally, as shown by the MACD indicator - a textbook “buy spot”. The convergence of the trendlines bounding the correction indicates a diminution of selling pressure with time, and is therefore bullish.

The sentiment is being expressed in some quarters that gold is unlikely to do much between now and August because seasonally it is a flat time, which presumably implies that it can't go up much because everyone's in vacation mood and off fly fishing or whatever. While this may be an important background consideration in years past, we are no longer living in normal times, as many Wall St professionals found out last August when the general stockmarket caved in, completely oblivious to family vacation priorities. Thus the notion that gold (and other commodities and markets for that matter) is going to hang around until little Johnny and Suzy go back to school in September before it gets moving will likely prove to be ill-founded.
After the rally of the past week or so from the support level traders can adopt two approaches to buying. One is to watch for a near-term retreat back to the support level to buy at better prices - it is thought unlikely that it will drop below about $850, but it could drop back to the lower Wedge support line now near the 200-day moving average. The other is to wait for a clear upside breakout from the Wedge. Although this approach involves paying more, it is safer as the breakout will signal the start of a new uptrend. A third approach of course is to buy now, accepting the (now limited) downside risk.
As gold's reaction since mid-March has synchronized with a relief rally in the dollar, as might be expected, the outlook for the dollar clearly has a crucial bearing on gold's prospects, so we will now examine the dollar charts.

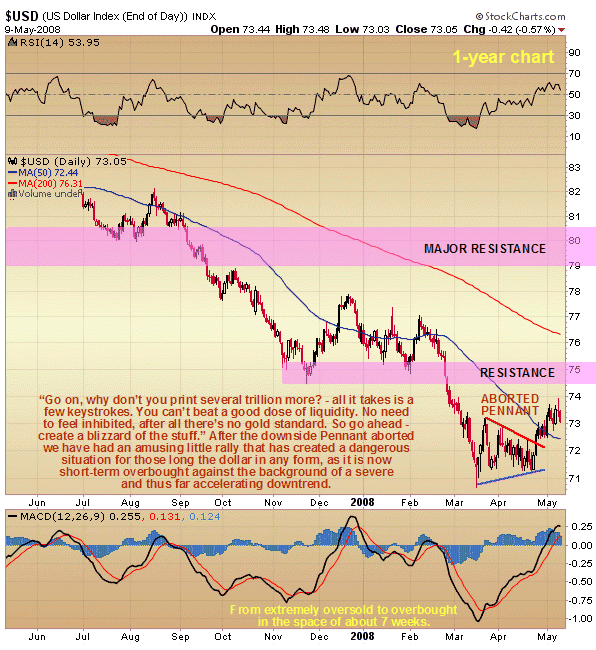
In April we saw a typical example of market chicanery when the dollar index looked like it was forming a down Pennant. On the 1-year chart we can see this Pennant and how it aborted, leading to a weak countertrend rally, which has battled its way through first the falling 50-day moving average and then towards the strong overhead resistance shown, in the process drawing close to the key parabolic resistance shown on the 3-year chart below. The rally from mid-March, far from being a bullish development for the dollar, has opened up a crevasse beneath it, as in addition to the rally being simply a countertrend rally occurring within the context of a severe downtrend, it has resulted in short-term oscillators swinging from an oversold extreme in mid-March into overbought territory, witness the MACD indicator at the bottom of this chart.

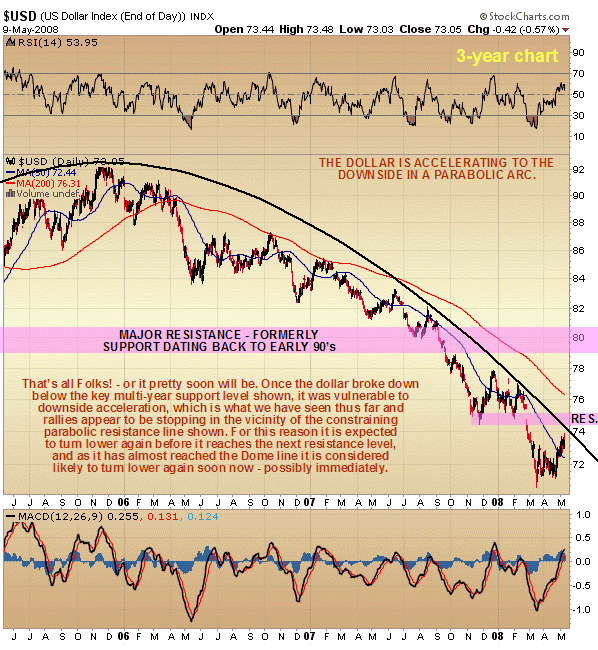
The 3-year chart for the dollar reveals that it is accelerating to the downside beneath the constraint of a parabolic dome downtrend. The acceleration to the downside followed the failure of a key long-term support level in the Fall that dated all the way back to the early 90's. This former support level has morphed into a zone of strong overhead resistance. As we can see, the parabolic dome is now not far above the index, meaning that it is unlikely that it will even make it to the first resistance level shown before it turns lower again, and it could break lower almost immediately now. This of course will be great news for gold and silver, which should break out from their current intermediate downtrends to commence their next major uptrend that is expected to take them to new highs.

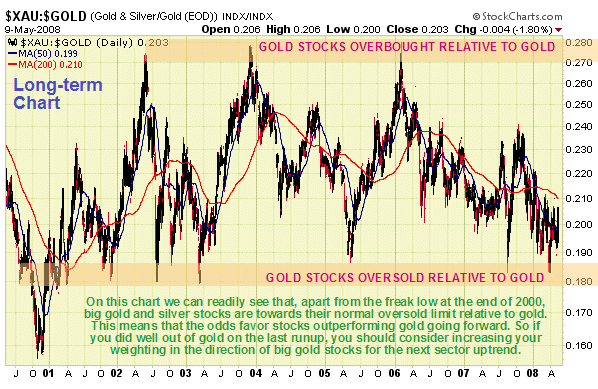
The underperformance of Precious Metals stocks on the last runup by gold and silver was a source of considerable frustration to holders of these stocks. The good news regarding this for PM stock investors is that the tables are likely to be turned on next sector uptrend. This is because the stocks to gold ratio is close to a cyclical low as can be seen on the accompanying long-term chart for the XAU index relative to the gold price. This chart indicates a strong probability that PM stocks will do much better on the next advance - they should at least match gold and there is a good chance they will outperform. What this means is that those who did well with gold itself during the last runup should consider increasing the weighting in big gold stocks ahead of the next uptrend. Curiously, despite silver outperforming gold in the recent past, big silver stocks have been savaged over the past 6 weeks or so, with the result that their charts have suffered technical damage due to the creation of a supply overhang. This is the reason why we concentrated on taking positions in the large gold stocks on the site over the past week or so, whose charts generally look a lot healthier.
By Clive Maund
CliveMaund.com
© 2008 Clive Maund - The above represents the opinion and analysis of Mr. Maund, based on data available to him, at the time of writing. Mr. Maunds opinions are his own, and are not a recommendation or an offer to buy or sell securities. No responsibility can be accepted for losses that may result as a consequence of trading on the basis of this analysis.
Mr. Maund is an independent analyst who receives no compensation of any kind from any groups, individuals or corporations mentioned in his reports. As trading and investing in any financial markets may involve serious risk of loss, Mr. Maund recommends that you consult with a qualified investment advisor, one licensed by appropriate regulatory agencies in your legal jurisdiction and do your own due diligence and research when making any kind of a transaction with financial ramifications.
Clive Maund Archive |
© 2005-2022 http://www.MarketOracle.co.uk - The Market Oracle is a FREE Daily Financial Markets Analysis & Forecasting online publication.


