Will Crashing Commodities Crash the Stock Market?
Stock-Markets / Financial Markets 2014 Jul 29, 2014 - 10:47 AM GMTBy: Clif_Droke

 There are some analysts out there who maintain that the precipitous decline in commodity prices this year bodes ill for the stock market.
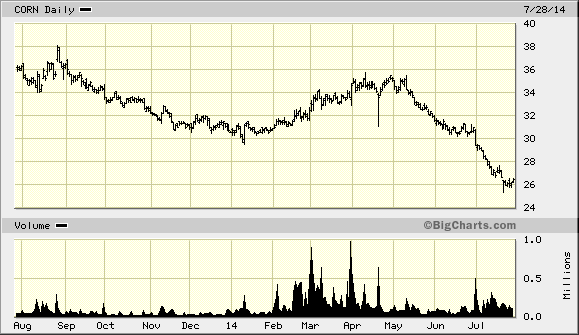
Witness for example the dramatic drop in the price of corn. Below is a chart of the Teucrium Corn Fund (CORN), a proxy for corn futures. As you can see, corn prices are at multi-year lows right now. This is ironic given that the mainstream media assured us earlier this year that higher ag commodity prices were on the way.

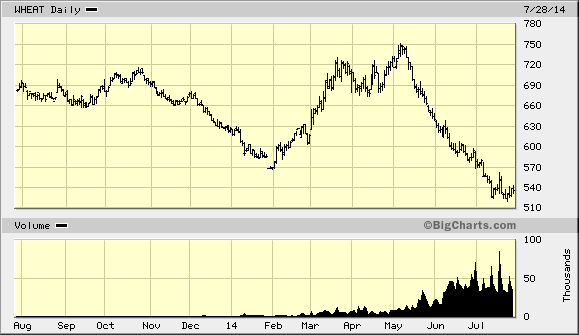
The price of wheat on the Chicago Board of Trade (CBOT) doesn’t present a rosy picture, either. Here you can see an equally conspicuous plunge in the wheat price to multi-year lows.

Question: Do falling commodity prices always lead to falling stock prices? Answer: Not always. To be more specific, a major decline in commodity prices is more likely to lead to equity market weakness if the decline in commodity values hurts countries which are big consumers of those commodities. This holds especially true for industrial metals like copper and iron as well as crude oil.
Consider the classic example of 1998. In that year there was a major bull market in stocks that extended into July of that year. Simultaneous to that was a major decline in commodity prices across the board. By the end of July, the general weakness in commodities spilled over into equities and led to a swift, dramatic plunge which saw the U.S. stock market briefly enter bear market territory by the end of August. It was in fact the shortest bear market on record for the U.S. There was an equally dramatic recovery for stocks in the fourth quarter of that year, but the correlation between weak commodity prices and the stock market was undeniable.
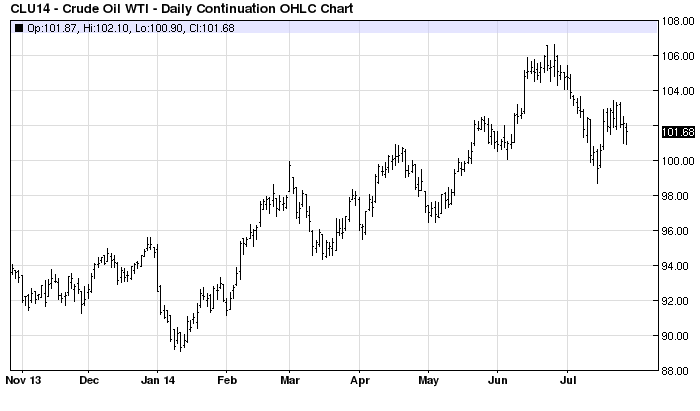
Flash forward to 2014. Many commodities have been weak this year, including grains and crude oil. Unlike 1998, however, oil prices can be described as fairly buoyant on an intermediate-term basis. In fact, the oil price rallied from a major low in January until peaking last month. The pullback since the June peak has been fairly small and contained up until now notwithstanding media rhetoric to the contrary.

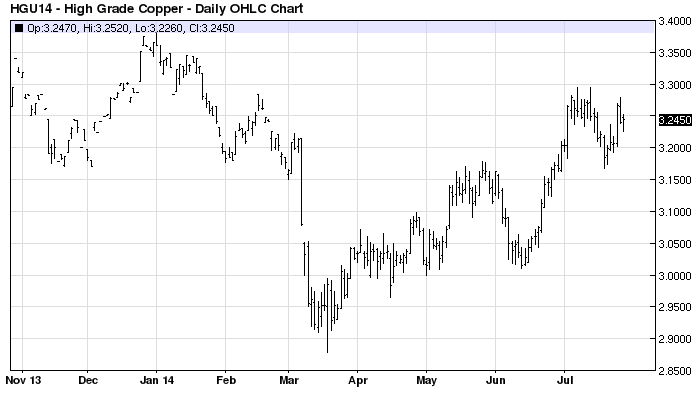
The copper price, which is an important barometer of global economic strength, has also held its own in recent months despite being relatively weak on a longer-term basis. Copper prices were much lower in 1998 and were closer to all-time lows at the time.

Another consideration is the major foreign markets. Heading into the summer of 1998, most foreign markets were in considerable danger and some were outright crashing. China, Japan, Russia, Argentina, Brazil and many others were swooning. This time around the aforementioned markets are either holding their own or are at or near yearly highs. If the commodity market weakness were truly deflationary on a global scale, it would show up in the form of foreign stock market weakness since foreign markets are much more dependent on commodity prices than the U.S. But right now we’re not seeing that.
While it’s possible that there could be a “summer swoon” later this summer as we head closer to the 60-year cycle bottom in late September, the odds of a 20 percent or greater correction are looking pretty slim right now. Most of the commodities weakness is relegated to grains and oilseeds; even the financially sensitive gold market is showing a moderate amount of strength. In short, most barometers of financial/economic strength aren’t suggesting an imminent bout of financial contagion, unlike the 1998 episode.
High Probability Relative Strength Trading
Traders often ask what is the single best strategy to use for selecting stocks in bull and bear markets? Hands down, the best all-around strategy is a relative strength approach. With relative strength you can be assured that you’re buying (or selling, depending on the market climate) the stocks that insiders are trading in. The powerful tool of relative strength allows you to see which stocks and ETFs the “smart money” pros are buying and selling before they make their next major move.
Find out how to incorporate a relative strength strategy in your trading system in my latest book, High Probability Relative Strength Analysis. In it you’ll discover the best way to identify relative strength and profit from it while avoiding the volatility that comes with other systems of stock picking. Relative strength is probably the single most important, yet widely overlooked, strategies on Wall Street. This book explains to you in easy-to-understand terms all you need to know about it. The book is now available for sale at:
http://www.clifdroke.com/books/hprstrading.html
Order today to receive your autographed copy along with a free booklet on the best strategies for momentum trading. Also receive a FREE 1-month trial subscription to the Momentum Strategies Report newsletter.
By Clif Droke
www.clifdroke.com
Clif Droke is the editor of the daily Gold & Silver Stock Report. Published daily since 2002, the report provides forecasts and analysis of the leading gold, silver, uranium and energy stocks from a short-term technical standpoint. He is also the author of numerous books, including 'How to Read Chart Patterns for Greater Profits.' For more information visit www.clifdroke.com
Clif Droke Archive |
© 2005-2022 http://www.MarketOracle.co.uk - The Market Oracle is a FREE Daily Financial Markets Analysis & Forecasting online publication.


