Gold And Silver Price Golden Cross
Commodities / Gold and Silver 2014 Jul 14, 2014 - 09:59 AM GMTBy: Submissions
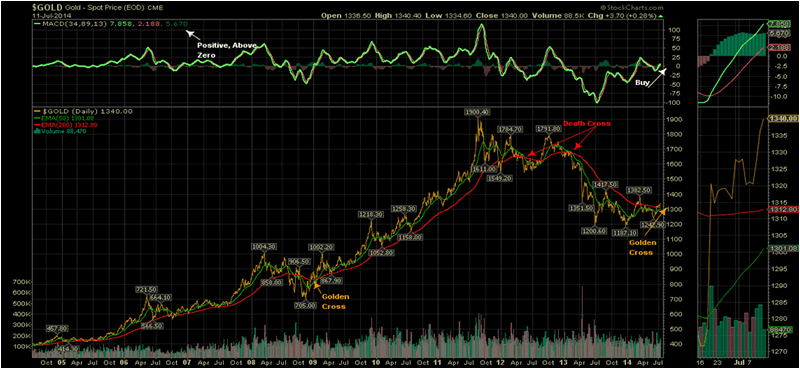
 Clay Tom writes: Week before last I send you theis Daily 10year Chart on Gold showing and imminent Golden Cross of the 50EMA/200EMA. I will narrow the time down and focus in on the past six months below the 10 year chart. Notice that the Macd are stabilized above Zero which means an Uptrend is in.
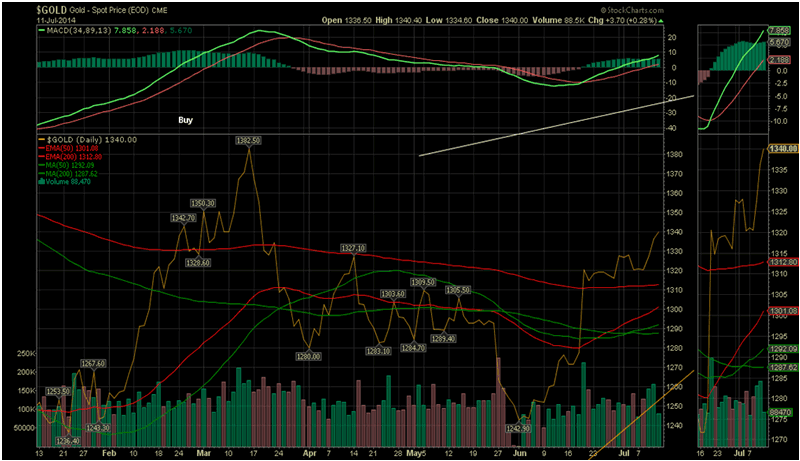
Gold six month Daily chart. The Red Ma`s are the Ema, Exponential Moving Average which will cross with a bit more upside effort. The Green are the Simple Arithmetic Moving Averages, WHICH HAVE CROSSED UP this last week.. So either way, this supports the Articles by the contributors of Gold and Silver
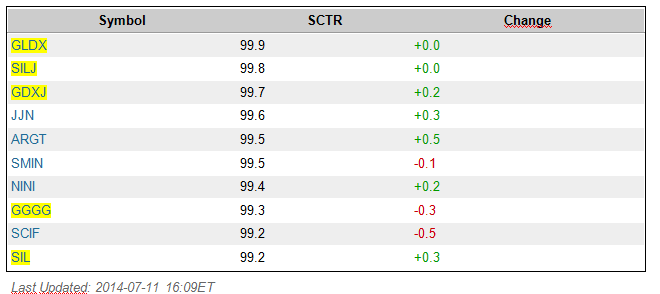
Also, giving credit to stockcharts.com, John Murphy offers an indicator called SCTR which is the Relative Strength, in this case, of ETFs. Note out of the top 10, five are Gold or Silver. I will illustrate with a chart of GDXJ, Junior Miners, with the SCTR displayed.
ETF SCTRs
This is the Daily 6mos chart for GDXJ, Junior Gold Miners, with a rank of 99.7 with 100, SCTR, Relative Strength being the maximum. Notice the week of June 9th how the SCTR of GDXJ came from 5 to 99 and now 99.7. JNUG is the ETF Direxcion x3 of GDXJ. Notice on the lower inset is JNUG which has more than doubled since the First of June for those looking for more leverage and using 2x Margin, Caveat.. one has to be absolutely correct to do this.
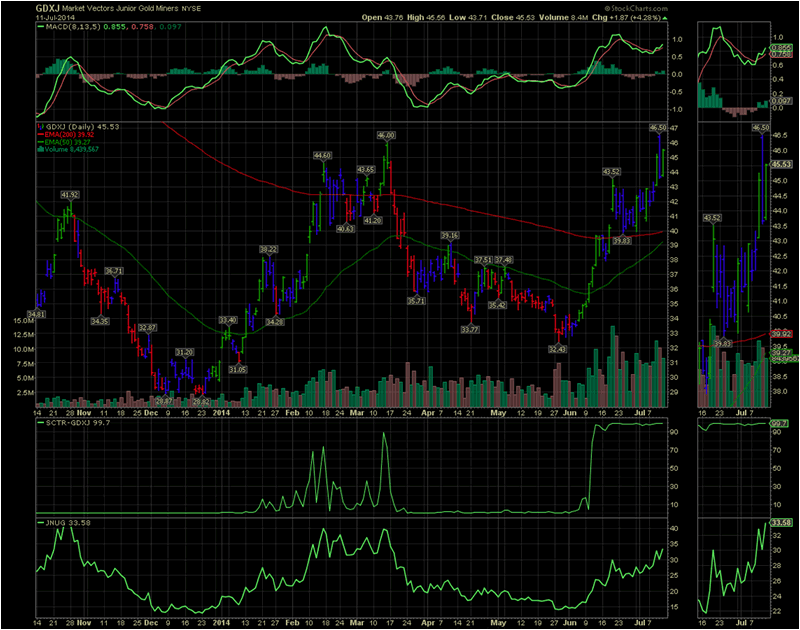
If GDXJ has an SCTR of 99.7 then JNUG would have an SCTR of 200 plus if it could be shown. I did a ration of JNUG:GDXJ which shows the better performance of JNUG compared to GDXJ with a 99.7 SCTR
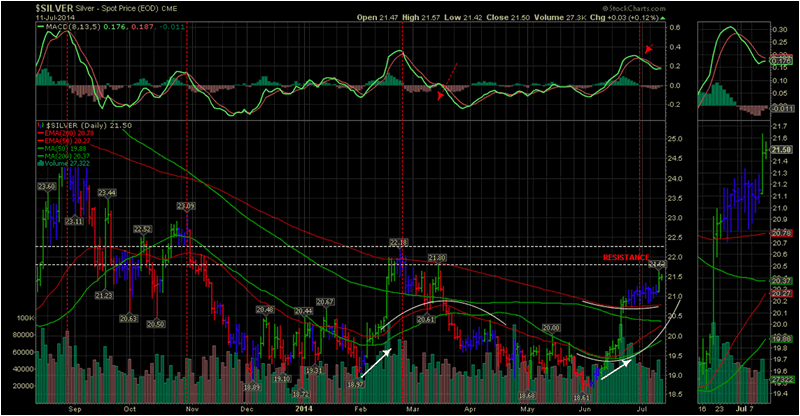
Silver Daily six months .. Notice the Red 200 Ema has leveled off from a long down trend and the Red 50Ema is moving up sharply. The Green Simple MA are also ready to Cross Up.

I hope this information is useful.
Clay Tom is a retired pharmacist and ex Asst. Vice President in Commodity Trading with Dean Witter back in the early 1970s. He says the service which stockcharts.com offers is a blessing, compared to the days we had to do charting manually after market hours without the electronic Indicators we now have access to, and to share with KWN readers.
© 2014 Copyright Clay Tom - All Rights Reserved
Disclaimer: The above is a matter of opinion provided for general information purposes only and is not intended as investment advice. Information and analysis above are derived from sources and utilising methods believed to be reliable, but we cannot accept responsibility for any losses you may incur as a result of this analysis. Individuals should consult with their personal financial advisors.
© 2005-2022 http://www.MarketOracle.co.uk - The Market Oracle is a FREE Daily Financial Markets Analysis & Forecasting online publication.


