


Gold Price Bracing for a Short-Term Correction
Commodities / Gold and Silver 2014 Jul 10, 2014 - 07:27 PM GMTBy: Jim_Curry

 In my prior article from back in early-June, I noted that a short-term bottom was due, which had been projected for the June 2nd timeframe, plus or minus a day. The actual low for Gold was registered the very next trading day, doing so on June 3rd at the 1240.20 figure. Since then, we have seen a rally of over $100 playing out with the metal, which is now looking for a short-term correction in the days/weeks ahead.
Take a look again at the chart below:
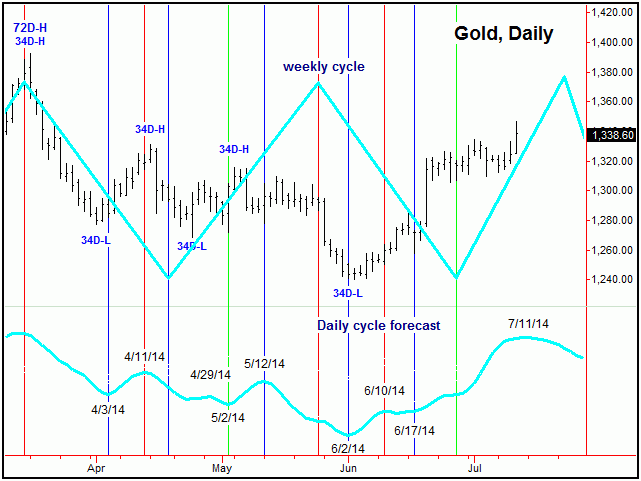
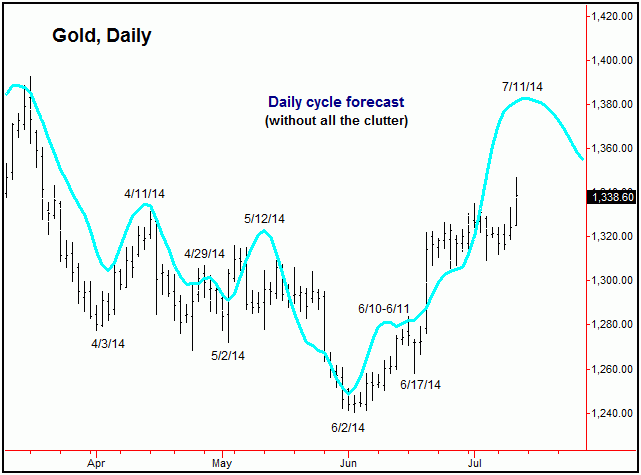
The chart above shows the daily/weekly cycle forecast path, which is shown in aqua. This chart is simply a combination of the dominant cycles that track the Gold futures contract, projected into the near future. Of note is that the next forecast peak for the short-term daily cycle is due right around the current timeframe - set for July 11th, which is plus or minus a day or so in either direction. From this high, the metal is projected to be weaker into what is looking to be later this month (exact date still tentative).
On the above chart, the most important periods are when both the daily and weekly forecast paths are moving in the same direction. The green vertical lines show when both forecasts are moving higher, and the red lines are when both models are forecasting lower prices. A blue vertical line is shown when the models are in disagreement (i.e., a ‘neutral’ condition).
With the above, we can see that when both forecast paths are in alignment, the market tends to move strongly in that direction. I should add that, when the daily and weekly forecasts disagree, that the market has more of a tendency to follow the shorter-term (daily) forecast path - but only when technical action is in agreement.
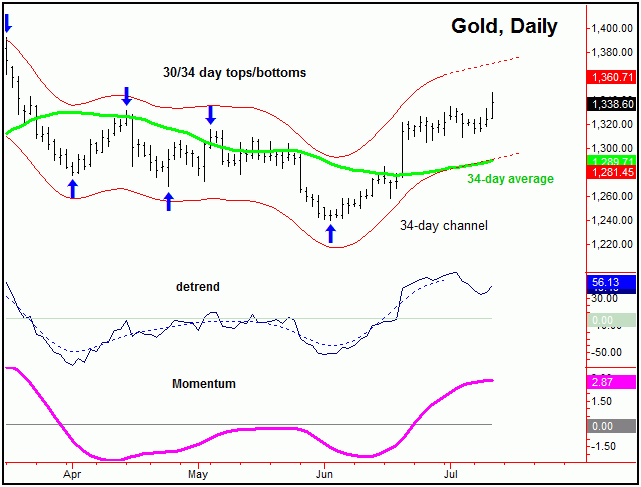
Take a look now at our next chart:
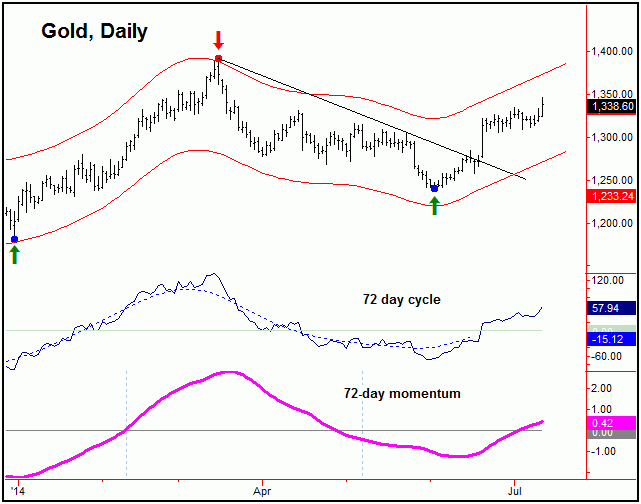
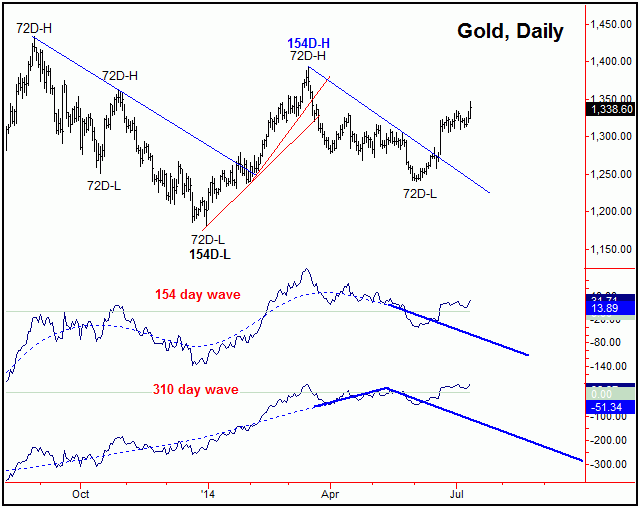
Stepping back, there is an even-larger 72-day cycle (shown above) for Gold, one that also bottomed at the 6/3/14 low - and thus is heading higher off the same. With that configuration of this larger wave, the probabilities tend to favor the whatever correction phase that is seen with the 34-day component to end up as a ‘higher-low’ – remaining at or well above the 1240.20 figure.
If the above assessment is correct, then the current speculation is that a low with the 34-day cycle around mid-to-late July, if seen, would then give way to another run to or above the recent swing top on the following upward phase of this component. If that should materialize, this would then set up the next peak for the larger 72-day cycle into August, prior to a sharp decline phase into what is now looking to be the month of September, where the larger 154-day cycle is next due to trough.
The chart above shows the 154-day wave, as well as an even-larger 310-day component - the latter of which is less dominant. With that, though still a bit sketchy at the present time (since we can look only so far out with the various cycles), it looks like a September bottom with these waves, if seen, should give way to the strongest rally of this year. If whatever low that ends up being seen with the 154-day wave is able to remain above the 1181.00 figure (which is the prior trough for this component, back back in December, 2013), then the cycle will have formed the bullish pattern of a ‘higher-low’. And, when this pattern has been seen in the past, the probabilities are in the range of 80%-or-better that the prior top for the cycle (i.e., currently deemed to be 1392.80) will be taken out on its next upward phase.
The bottom line with the above is that while Gold was due for a rally back in early-June (where the cycles were bottoming), it is now looking for a short-term correction in the next week or two, ideally coming from the 34-day cycle. At that point, the assumption is that decline will be followed by another run at the highs on the next upward phase of this cycle, then to peak the larger 72-day component.
Jim Curry
Market Turns Advisory
Email: jcurry@cycle-wave.com
Jim Curry is the editor and publisher of The Gold Wave Trader, which specializes in the use of cyclic and statistical analysis to time the markets. He is also the author of several trading-related e-books, including ‘The Volatility Reversal Method’, also ‘Cycles & Moving Averages’. He can be reached at the URL above.
Copyright 2013, Jim Curry - Disclaimer - The financial markets are risky. Investing is risky. Past performance does not guarantee future performance. The foregoing has been prepared solely for informational purposes and is not a solicitation, or an offer to buy or sell any security. Opinions are based on historical research and data believed reliable, but there is no guarantee that future results will be profitable. The methods used to form opinions are highly probable and as you follow them for some time you can gain confidence in them. The market can and will do the unexpected, use the sell stops provided to assist in risk avoidance. Not responsible for errors or omissions.
Jim Curry Archive |
© 2005-2022 http://www.MarketOracle.co.uk - The Market Oracle is a FREE Daily Financial Markets Analysis & Forecasting online publication.