


Gold and Silver Miners The Beginning of the End!
Commodities / Gold and Silver Stocks 2014 Jul 10, 2014 - 01:02 PM GMT

 I think today's price action marks a very important confirmation point in the precious metals stock indexes, at least for the intermediate to longer term outlook. Finally, after a year of chopping around in small up and down moves, we are starting to get some confirmation that this one year trading range is indeed a reversal pattern and not a consolidation pattern. When a big patterns like this ends is when you get the big impulse moves which is where you make the real money.
As you have found out trading ranges can be very frustrating to trade especially when there is no real horizontal support and resistance rails. The inverse H&S bottom was hard to trade because there were many smaller moves within the one year trading range. There were also several patterns that failed to mature which also made it difficult to know if we were forming a consolidation pattern or reversal pattern. It always looks easy in hindsight but when you are living through one of these very large trading ranges it's a totally different ballgame. Patterns can morph and grow larger than what one might have first anticipated on the front end. The name of the game is to protect ones capital and is one reason why we were in and out trying to catch part of the small moves inside the big one year trading range. Sometimes you win and sometimes you lose but preservation of capital will guarantee that you will be able to play the next impulse move when it finally arrives. We did that.
For those members that were with Rambus Chartology back in December of 2012 know what its like to ride an impulse move. It's a totally different ball game vs consolidation trading. We did very little trading during that huge impulse move down holding on for dear life every time there was a counter trend rally. It would have been easy to sell out during those short term counter trend moves but we held on and captured the lions share of that big impulse move down. Now after a year of going nowhere it looks like we are on the cusp of another important impulse move, this time higher, which gives us many more options to trade with vs just going short.
If this is truly the beginning of a new impulse move higher the toughest thing you will face is the urge to sell out and take a small profit. I know folks are already looking for the exits because they have decent profit but one of the biggest lesson I've learned through the years is not to try and trade an impulse move. You will get your small profit but you will find it nearly impossible to get back in at a lower price than where you exited your initial position. It's the nature of the impulse move to take as few investors for the ride as possible until you arrive at the end of the move.
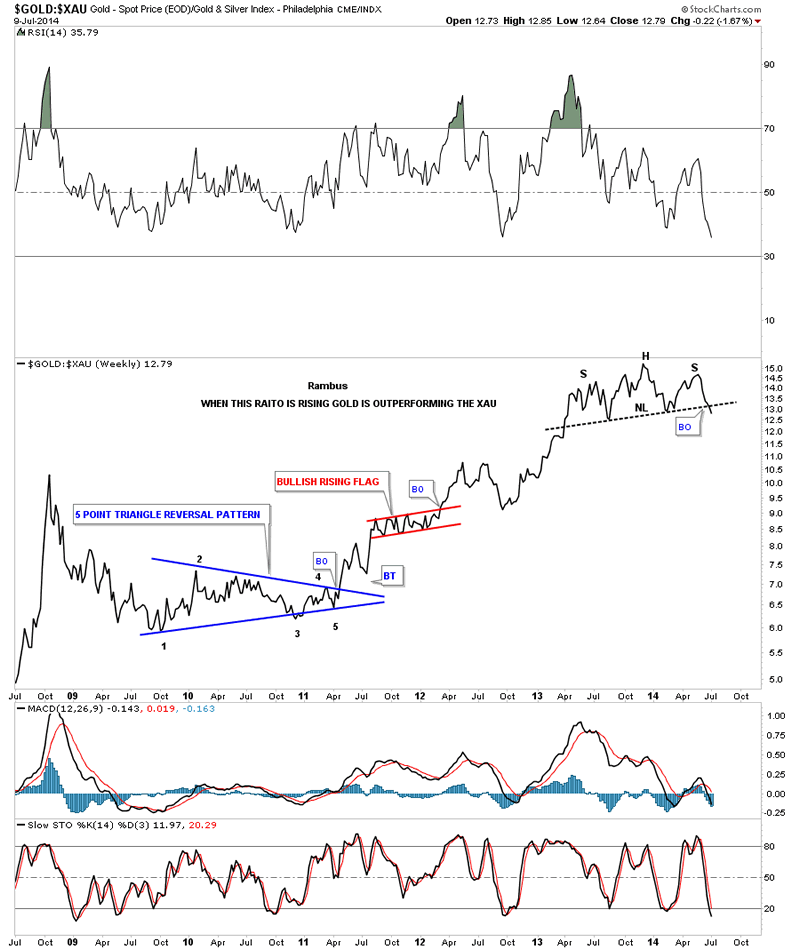
The first chart I would like to show is the the Gold:XAU ratio chart that we've been following for years now. It still amazes me how far out of whack this ratio got. Just when you thought it couldn't go any higher it did. Below is a weekly line chart that is finally showing us that the end is at hand and the XAU is now going to outperform gold, probably in a big way, revision back to the means. I'm using a line chart because it often times gives you an earlier confirmation than a bar chart. As you can see this ratio just broke the neckline of a one plus year H&S top that is now reversing the uptrend that has been in place since October of 2009. This is a big deal folks and it shouldn't be taken lightly. This nearly five year uptrend, where gold has outperformed the XAU, is coming to an end. The precious metals stocks are now the place to be.
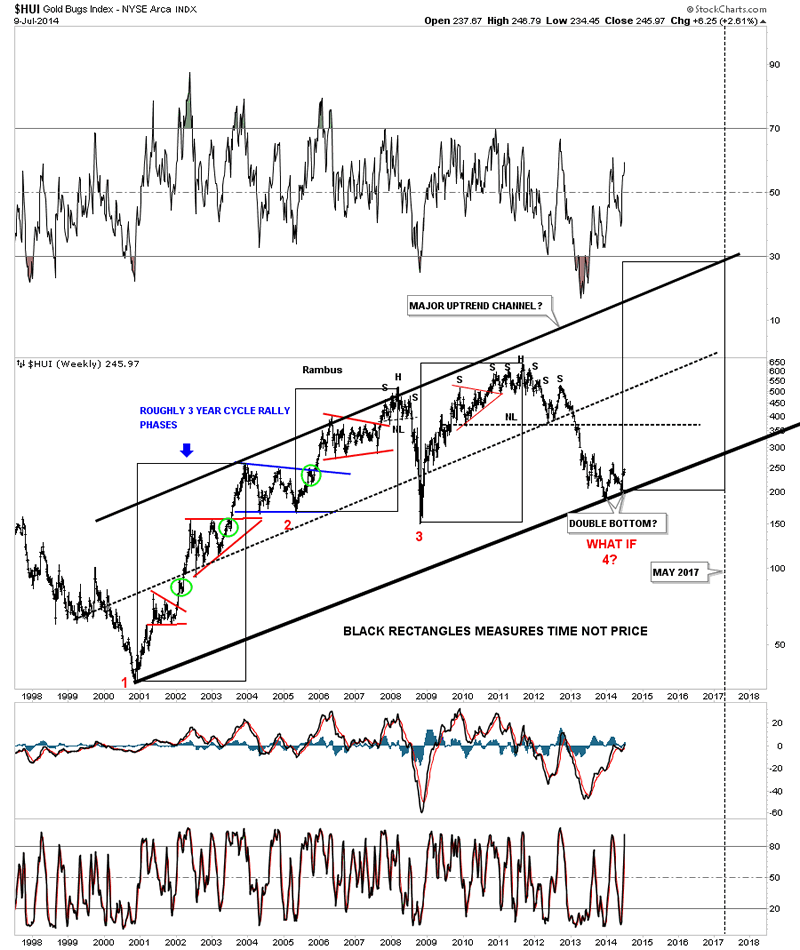
Below is a long term weekly chart for the HUI that shows the major uptrend channel beginning back in late 2000. This chart shows you what I mean when I talk about an impulse move. Note all the consolidation patterns that formed in the bull market from late 2000 to the 2008 H&S top. Each impulse move started with the last reversal point in each consolidation pattern. You can clearly see the different characteristics from the price action when the HUI was forming a consolidation pattern vs the price action, impulse move, when the consolidation pattern finished building out. The move between each consolidation pattern is an impulse move. That is where the big money is made. What generally happens is, if you caught part of the impulse move up and had a decent profit, you probably gave most of it back during the next consolidation pattern. Sound familiar.
I have a lot of work to do tonight so I'm going to end it right here. Today was a very positive day for the precious metals stocks. If we are right then the beginning of the end is at hand.
All the best
Gary (for Rambus Chartology)
FREE TRIAL - http://rambus1.com/?page_id=10
© 2014 Copyright Rambus- All Rights Reserved
Disclaimer: The above is a matter of opinion provided for general information purposes only and is not intended as investment advice. Information and analysis above are derived from sources and utilising methods believed to be reliable, but we cannot accept responsibility for any losses you may incur as a result of this analysis. Individuals should consult with their personal financial advisors.
© 2005-2022 http://www.MarketOracle.co.uk - The Market Oracle is a FREE Daily Financial Markets Analysis & Forecasting online publication.